Evaluation
Every number on this page is produced by a script in benchmarks/ and written to benchmarks/results/; the result
tables below are those files, included verbatim. Everything is seeded and path enumeration does not depend on the
interpreter's hash seed. The rolling feeds are dated in each output (EPSS scores of 2026-09-25, KEV catalog
2026.09.25). Commands and runtimes: Reproduce.
Methodology
Topology families. linchpin.synth.topologies generates four families, 50 seeds each, with 12 + (seed mod 49)
hosts (12-60 hosts, 58-317 attack-graph nodes):
single: one bastion between the DMZ and everything else (exact min cut 1);multi: 2-3 parallel bastions and two independent routes into the database (min cut 2, no chokepoint);none: a flat network whose database exposes several code-execution services (min cut about 7, larger than the budget, so no 3-fix plan can disconnect it);ad: tiered Active Directory with helpdesk local-admin reuse and server-admin and Domain-Admin sessions cached on lower tiers (min cut 1.34 on average; half the seeds add a KEV-listed RCE on the domain controller).
Every family also contains planted distractors: two isolated hosts with a KEV-listed RCE of CVSS >= 9.0 (decoys nothing can reach) and high-CVSS vulnerabilities without code execution on reachable hosts (noise). They are what a score-sorted queue spends its budget on, which is why the benchmark also runs the queues restricted to vulnerabilities that lie on some entry-to-crown-jewel route.
Vulnerability parameters come from a KEV-enriched stratified sample of 3,000 real CVEs
(src/linchpin/synth/data/cve_pool.csv): NVD vector and exploitability sub-score, EPSS and KEV status. KEV is
deliberately over-represented (10% of the pool against about 0.5% of the source population) so KEV-first queues have
KEV entries to pick.
Planners (budget 3 fixes, k = 100 enumerated paths):
| planner | rule |
|---|---|
| LINCHPIN | exact minimum vertex cut when it fits the budget, otherwise greedy set cover of the enumerated paths |
| LINCHPIN greedy only | the set cover alone |
| Exact interdiction MILP | Israeli & Wood (2002): maximise the attacker's cheapest-path cost after at most 3 removals (HiGHS) |
| Greedy interdiction | Guo et al.-style: repeatedly remove the node on the cheapest path whose removal raises its cost most |
| Best patch-only plan | LINCHPIN's planner restricted to vulnerabilities (exact cut over vulns when it fits the budget, else greedy over vulns): the like-for-like ceiling for the score queues, which may also only patch |
| CVSS / EPSS / KEV-then-EPSS | highest score first, over all vulnerabilities |
| ... on-path only | the same queues restricted to vulnerabilities on an entry-to-crown-jewel route |
| Betweenness, random | highest cost-weighted betweenness among remediable nodes; 3 nodes drawn uniformly from all remediable nodes (vulns, credentials, ACEs, non-entry hosts), on an attack path or not |
The planners do not share an action space: the score queues may only patch, while LINCHPIN, the interdiction planners, betweenness and random may also segment a host or rotate a credential. The best patch-only plan separates the two effects.
Metrics. Disconnect: no crown jewel reachable afterwards. Residual paths: enumerated paths left, as a share of those before (capped at k). Cost gain: rise of the attacker's cheapest-path cost on topologies that stay connected. Share of optimal gain: cost gain divided by the MILP's. Fixes needed (ablation): how many of a planner's fixes, in its own order, the real graph needs before it is disconnected, relative to the exact optimum.
Statistics. 95% Wilson intervals for rates; seeded percentile bootstrap (2,000 replicates) for means, not shown when fewer than 10 topologies contribute; exact two-sided McNemar tests for paired disconnect outcomes on the same topologies; for paired cost gains, a bootstrap interval of the mean difference over the topologies and an exact sign test. p-values are printed as "p < 1e-4" or with three significant digits.
Provenance. Each result file records the commit (and whether code had uncommitted changes) or the CI run that
produced it. The benchmark and ablation tables below are the artefacts of the manual results workflow, run
37089520295 at commit 0c72593 on a Linux runner;
every outcome cell (all columns except the millisecond timings) equals the v1.1.0 run on Windows.
What the 100% means
LINCHPIN plans on the same graph it is scored on, and it returns the exact minimum cut whenever that cut fits the
budget, so its disconnect rate is 100% by construction wherever a 3-fix cut exists (all of single, multi and
ad). The benchmark measures how far other planners are from that optimum inside LINCHPIN's attack-graph
model, not real-world risk; the ablation measures what happens when the planner's data is incomplete.
Synthetic benchmark
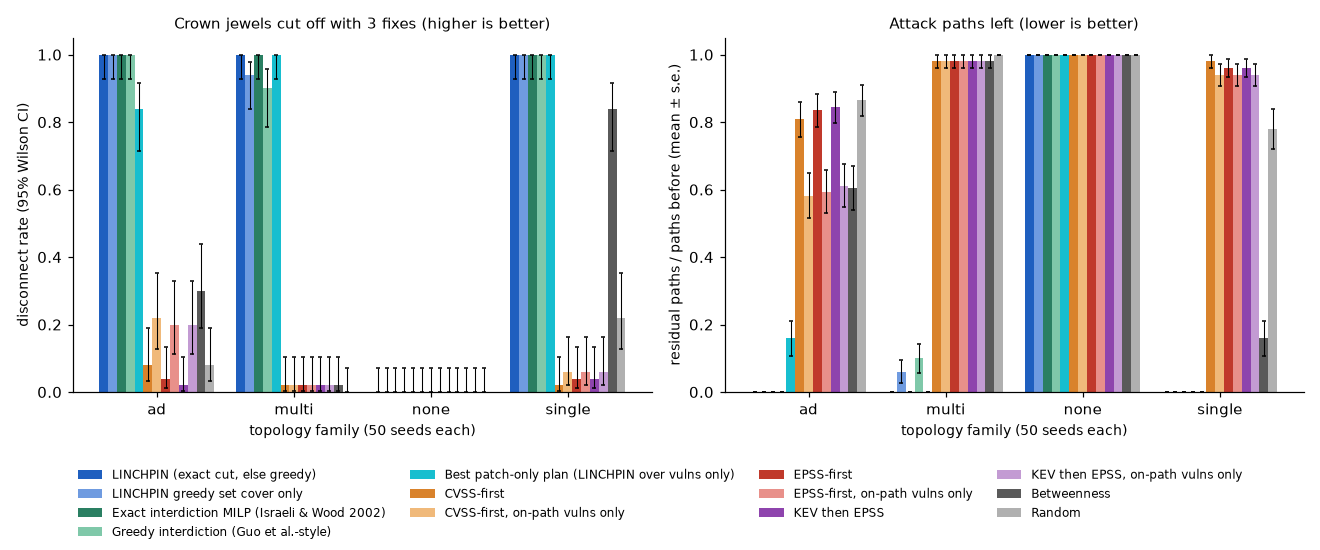
Budget = 3 fixes per topology. Disconnect = no crown jewel reachable afterwards (95% Wilson interval). Residual = attack paths still enumerated (capped at k=100) as a fraction of before (mean ± s.e.). Cost gain = rise of the attacker's cheapest-path cost on topologies that stay connected (95% seeded bootstrap interval; n = such topologies; no interval when n < 10). p = exact McNemar test of the disconnect outcome against LINCHPIN on the same topologies.
ad: n=50, 12-60 hosts (58-225 nodes, mean 144), single-node chokepoint in 66%, mean exact min cut 1.34 fixes
| strategy | disconnect rate | p vs LINCHPIN | residual paths | attacker cost gain (still connected) | share of optimal gain | ms |
|---|---|---|---|---|---|---|
| LINCHPIN (exact cut, else greedy) | 100% [93%, 100%] | - | 0.00 ± 0.00 | n/a (all disconnected) | - | 182 |
| LINCHPIN greedy set cover only | 100% [93%, 100%] | 1 | 0.00 ± 0.00 | n/a (all disconnected) | - | 150 |
| Exact interdiction MILP (Israeli & Wood 2002) | 100% [93%, 100%] | 1 | 0.00 ± 0.00 | n/a (all disconnected) | - | 27 |
| Greedy interdiction (Guo et al.-style) | 100% [93%, 100%] | 1 | 0.00 ± 0.00 | n/a (all disconnected) | - | 4 |
| Best patch-only plan (LINCHPIN over vulns only) | 84% [71%, 92%] | 0.00781 | 0.16 ± 0.05 | +0.375 (n=8, no CI: n<10) | - | 196 |
| CVSS-first | 8% [3%, 19%] | < 1e-4 | 0.81 ± 0.05 | +0.089 [+0.059, +0.122] (n=46) | - | 0 |
| CVSS-first, on-path vulns only | 22% [13%, 35%] | < 1e-4 | 0.58 ± 0.07 | +0.120 [+0.081, +0.163] (n=39) | - | 0 |
| EPSS-first | 4% [1%, 13%] | < 1e-4 | 0.83 ± 0.05 | +0.089 [+0.053, +0.130] (n=48) | - | 0 |
| EPSS-first, on-path vulns only | 20% [11%, 33%] | < 1e-4 | 0.59 ± 0.06 | +0.173 [+0.127, +0.219] (n=40) | - | 0 |
| KEV then EPSS | 2% [0%, 10%] | < 1e-4 | 0.84 ± 0.05 | +0.101 [+0.067, +0.141] (n=49) | - | 0 |
| KEV then EPSS, on-path vulns only | 20% [11%, 33%] | < 1e-4 | 0.61 ± 0.06 | +0.190 [+0.143, +0.239] (n=40) | - | 0 |
| Betweenness | 30% [19%, 44%] | < 1e-4 | 0.60 ± 0.07 | +0.087 [+0.049, +0.131] (n=35) | - | 66 |
| Random | 8% [3%, 19%] | < 1e-4 | 0.86 ± 0.05 | +0.015 [+0.002, +0.031] (n=46) | - | 0 |
greedy fixes-to-disconnect / exact min cut = 1.01 (optimal in 98%); top-1 is a true chokepoint in 100% of chokepoint topologies.
multi: n=50, 12-60 hosts (69-317 nodes, mean 186), single-node chokepoint in 0%, mean exact min cut 2.00 fixes
| strategy | disconnect rate | p vs LINCHPIN | residual paths | attacker cost gain (still connected) | share of optimal gain | ms |
|---|---|---|---|---|---|---|
| LINCHPIN (exact cut, else greedy) | 100% [93%, 100%] | - | 0.00 ± 0.00 | n/a (all disconnected) | - | 762 |
| LINCHPIN greedy set cover only | 94% [84%, 98%] | 0.25 | 0.06 ± 0.03 | +0.307 (n=3, no CI: n<10) | - | 596 |
| Exact interdiction MILP (Israeli & Wood 2002) | 100% [93%, 100%] | 1 | 0.00 ± 0.00 | n/a (all disconnected) | - | 299 |
| Greedy interdiction (Guo et al.-style) | 90% [79%, 96%] | 0.0625 | 0.10 ± 0.04 | +0.399 (n=5, no CI: n<10) | - | 15 |
| Best patch-only plan (LINCHPIN over vulns only) | 100% [93%, 100%] | 1 | 0.00 ± 0.00 | n/a (all disconnected) | - | 966 |
| CVSS-first | 2% [0%, 10%] | < 1e-4 | 0.98 ± 0.02 | +0.067 [+0.036, +0.099] (n=49) | - | 0 |
| CVSS-first, on-path vulns only | 2% [0%, 10%] | < 1e-4 | 0.98 ± 0.02 | +0.071 [+0.039, +0.103] (n=49) | - | 1 |
| EPSS-first | 2% [0%, 10%] | < 1e-4 | 0.98 ± 0.02 | +0.073 [+0.048, +0.099] (n=49) | - | 0 |
| EPSS-first, on-path vulns only | 2% [0%, 10%] | < 1e-4 | 0.98 ± 0.02 | +0.134 [+0.099, +0.170] (n=49) | - | 1 |
| KEV then EPSS | 2% [0%, 10%] | < 1e-4 | 0.98 ± 0.02 | +0.080 [+0.055, +0.108] (n=49) | - | 0 |
| KEV then EPSS, on-path vulns only | 2% [0%, 10%] | < 1e-4 | 0.98 ± 0.02 | +0.144 [+0.107, +0.184] (n=49) | - | 1 |
| Betweenness | 2% [0%, 10%] | < 1e-4 | 0.98 ± 0.02 | +0.154 [+0.124, +0.187] (n=49) | - | 172 |
| Random | 0% [0%, 7%] | < 1e-4 | 1.00 ± 0.00 | +0.026 [+0.012, +0.043] (n=50) | - | 0 |
greedy fixes-to-disconnect / exact min cut = 1.22 (optimal in 62%).
none: n=50, 12-60 hosts (78-316 nodes, mean 196), single-node chokepoint in 0%, mean exact min cut 7.32 fixes
| strategy | disconnect rate | p vs LINCHPIN | residual paths | attacker cost gain (still connected) | share of optimal gain | ms |
|---|---|---|---|---|---|---|
| LINCHPIN (exact cut, else greedy) | 0% [0%, 7%] | - | 1.00 ± 0.00 | +0.193 [+0.169, +0.216] (n=50) | 0.83 [0.77, 0.88] | 428 |
| LINCHPIN greedy set cover only | 0% [0%, 7%] | 1 | 1.00 ± 0.00 | +0.193 [+0.169, +0.216] (n=50) | 0.83 [0.77, 0.88] | 381 |
| Exact interdiction MILP (Israeli & Wood 2002) | 0% [0%, 7%] | 1 | 1.00 ± 0.00 | +0.227 [+0.209, +0.245] (n=50) | 1.00 [1.00, 1.00] | 806 |
| Greedy interdiction (Guo et al.-style) | 0% [0%, 7%] | 1 | 1.00 ± 0.00 | +0.192 [+0.168, +0.215] (n=50) | 0.82 [0.75, 0.89] | 11 |
| Best patch-only plan (LINCHPIN over vulns only) | 0% [0%, 7%] | 1 | 1.00 ± 0.00 | +0.197 [+0.175, +0.220] (n=50) | 0.85 [0.79, 0.90] | 426 |
| CVSS-first | 0% [0%, 7%] | 1 | 1.00 ± 0.00 | +0.021 [+0.009, +0.034] (n=50) | 0.09 [0.04, 0.15] | 0 |
| CVSS-first, on-path vulns only | 0% [0%, 7%] | 1 | 1.00 ± 0.00 | +0.025 [+0.013, +0.040] (n=50) | 0.11 [0.06, 0.17] | 1 |
| EPSS-first | 0% [0%, 7%] | 1 | 1.00 ± 0.00 | +0.044 [+0.026, +0.067] (n=50) | 0.17 [0.10, 0.25] | 0 |
| EPSS-first, on-path vulns only | 0% [0%, 7%] | 1 | 1.00 ± 0.00 | +0.084 [+0.058, +0.113] (n=50) | 0.32 [0.24, 0.42] | 1 |
| KEV then EPSS | 0% [0%, 7%] | 1 | 1.00 ± 0.00 | +0.037 [+0.022, +0.056] (n=50) | 0.15 [0.09, 0.22] | 0 |
| KEV then EPSS, on-path vulns only | 0% [0%, 7%] | 1 | 1.00 ± 0.00 | +0.089 [+0.064, +0.118] (n=50) | 0.35 [0.26, 0.45] | 1 |
| Betweenness | 0% [0%, 7%] | 1 | 1.00 ± 0.00 | +0.025 [+0.012, +0.040] (n=50) | 0.10 [0.05, 0.16] | 173 |
| Random | 0% [0%, 7%] | 1 | 1.00 ± 0.00 | +0.002 [+0.000, +0.007] (n=50) | 0.01 [0.00, 0.02] | 0 |
greedy fixes-to-disconnect / exact min cut = 1.29 (optimal in 22%).
Paired on the same topologies (none disconnects): LINCHPIN's cost gain minus the strategy's, mean [95% bootstrap interval]; topologies where LINCHPIN's gain is larger / smaller / equal; exact sign test.
| strategy | LINCHPIN gain - strategy gain | larger / smaller / equal; p |
|---|---|---|
| LINCHPIN greedy set cover only | +0.000 [+0.000, +0.000] | 0 / 0 / 50; p = 1 |
| Exact interdiction MILP (Israeli & Wood 2002) | -0.034 [-0.047, -0.023] | 0 / 30 / 20; p < 1e-4 |
| Greedy interdiction (Guo et al.-style) | +0.001 [-0.016, +0.018] | 9 / 23 / 18; p = 0.0201 |
| Best patch-only plan (LINCHPIN over vulns only) | -0.004 [-0.010, +0.001] | 3 / 6 / 41; p = 0.508 |
| CVSS-first | +0.172 [+0.144, +0.199] | 47 / 1 / 2; p < 1e-4 |
| CVSS-first, on-path vulns only | +0.168 [+0.140, +0.194] | 47 / 1 / 2; p < 1e-4 |
| EPSS-first | +0.149 [+0.122, +0.173] | 46 / 0 / 4; p < 1e-4 |
| EPSS-first, on-path vulns only | +0.109 [+0.086, +0.130] | 41 / 1 / 8; p < 1e-4 |
| KEV then EPSS | +0.156 [+0.130, +0.182] | 46 / 0 / 4; p < 1e-4 |
| KEV then EPSS, on-path vulns only | +0.104 [+0.081, +0.125] | 41 / 1 / 8; p < 1e-4 |
| Betweenness | +0.168 [+0.145, +0.193] | 50 / 0 / 0; p < 1e-4 |
| Random | +0.190 [+0.167, +0.214] | 50 / 0 / 0; p < 1e-4 |
single: n=50, 12-60 hosts (65-290 nodes, mean 170), single-node chokepoint in 100%, mean exact min cut 1.00 fixes
| strategy | disconnect rate | p vs LINCHPIN | residual paths | attacker cost gain (still connected) | share of optimal gain | ms |
|---|---|---|---|---|---|---|
| LINCHPIN (exact cut, else greedy) | 100% [93%, 100%] | - | 0.00 ± 0.00 | n/a (all disconnected) | - | 299 |
| LINCHPIN greedy set cover only | 100% [93%, 100%] | 1 | 0.00 ± 0.00 | n/a (all disconnected) | - | 280 |
| Exact interdiction MILP (Israeli & Wood 2002) | 100% [93%, 100%] | 1 | 0.00 ± 0.00 | n/a (all disconnected) | - | 117 |
| Greedy interdiction (Guo et al.-style) | 100% [93%, 100%] | 1 | 0.00 ± 0.00 | n/a (all disconnected) | - | 5 |
| Best patch-only plan (LINCHPIN over vulns only) | 100% [93%, 100%] | 1 | 0.00 ± 0.00 | n/a (all disconnected) | - | 293 |
| CVSS-first | 2% [0%, 10%] | < 1e-4 | 0.98 ± 0.02 | +0.048 [+0.023, +0.081] (n=49) | - | 0 |
| CVSS-first, on-path vulns only | 6% [2%, 16%] | < 1e-4 | 0.94 ± 0.03 | +0.053 [+0.027, +0.087] (n=47) | - | 1 |
| EPSS-first | 4% [1%, 13%] | < 1e-4 | 0.96 ± 0.03 | +0.075 [+0.047, +0.110] (n=48) | - | 0 |
| EPSS-first, on-path vulns only | 6% [2%, 16%] | < 1e-4 | 0.94 ± 0.03 | +0.153 [+0.113, +0.197] (n=47) | - | 1 |
| KEV then EPSS | 4% [1%, 13%] | < 1e-4 | 0.96 ± 0.03 | +0.078 [+0.051, +0.113] (n=48) | - | 0 |
| KEV then EPSS, on-path vulns only | 6% [2%, 16%] | < 1e-4 | 0.94 ± 0.03 | +0.171 [+0.129, +0.217] (n=47) | - | 1 |
| Betweenness | 84% [71%, 92%] | 0.00781 | 0.16 ± 0.05 | +0.083 (n=8, no CI: n<10) | - | 152 |
| Random | 22% [13%, 35%] | < 1e-4 | 0.78 ± 0.06 | +0.028 [+0.008, +0.055] (n=39) | - | 0 |
greedy fixes-to-disconnect / exact min cut = 1.00 (optimal in 100%); top-1 = planted linchpin in 100%; top-1 is a true chokepoint in 100% of chokepoint topologies.
Pooled over ad, multi, single (n=150; the families where a 3-fix plan can disconnect):
| strategy | disconnect rate | LINCHPIN-only / strategy-only | p | strategy-only / random-only | p vs random |
|---|---|---|---|---|---|
| LINCHPIN (exact cut, else greedy) | 100% [98%, 100%] | - | - | 135 / 0 | < 1e-4 |
| LINCHPIN greedy set cover only | 98% [94%, 99%] | 3 / 0 | 0.25 | 132 / 0 | < 1e-4 |
| Exact interdiction MILP (Israeli & Wood 2002) | 100% [98%, 100%] | 0 / 0 | 1 | 135 / 0 | < 1e-4 |
| Greedy interdiction (Guo et al.-style) | 97% [92%, 99%] | 5 / 0 | 0.0625 | 130 / 0 | < 1e-4 |
| Best patch-only plan (LINCHPIN over vulns only) | 95% [90%, 97%] | 8 / 0 | 0.00781 | 127 / 0 | < 1e-4 |
| CVSS-first | 4% [2%, 8%] | 144 / 0 | < 1e-4 | 5 / 14 | 0.0636 |
| CVSS-first, on-path vulns only | 10% [6%, 16%] | 135 / 0 | < 1e-4 | 10 / 10 | 1 |
| EPSS-first | 3% [1%, 8%] | 145 / 0 | < 1e-4 | 4 / 14 | 0.0309 |
| EPSS-first, on-path vulns only | 9% [6%, 15%] | 136 / 0 | < 1e-4 | 9 / 10 | 1 |
| KEV then EPSS | 3% [1%, 7%] | 146 / 0 | < 1e-4 | 3 / 14 | 0.0127 |
| KEV then EPSS, on-path vulns only | 9% [6%, 15%] | 136 / 0 | < 1e-4 | 9 / 10 | 1 |
| Betweenness | 39% [31%, 47%] | 92 / 0 | < 1e-4 | 46 / 3 | < 1e-4 |
| Random | 10% [6%, 16%] | 135 / 0 | < 1e-4 | - | - |
Difference in the share of enumerated attack paths (k-capped) left after 3 fixes, CVSS-first minus LINCHPIN, over all 200 topologies: 69.2% [62.7%, 75.5%] (bootstrap). Per family: ad 80.9% [70.8%, 90.8%], multi 98.0% [94.0%, 100.0%], none 0.0% [0.0%, 0.0%], single 98.0% [94.0%, 100.0%]. Over the 150 topologies of ad, multi, single (where a 3-fix cut exists): 92.3% [87.8%, 96.0%]. In none both plans leave the k-capped re-enumeration full, so that family contributes 0. Produced by CI run 37089520295 at commit 0c72593ea68e (4 workers, 220.4 s).
Ablation
Budget 3 fixes, 50 seeds per family. Each planner runs the same optimiser on a degraded view of the findings; its plan is scored on the full ground-truth graph. Cells: share of topologies where the crown jewel is cut off, 95% Wilson interval, and the exact McNemar p-value of the paired difference to the fused planner (omitted when the two never differ). The fused planner plans on the very graph it is scored on, so its 100% is guaranteed whenever the exact min cut fits the budget (max-flow / min-cut); the evidence is how far each degraded view falls short of it.
| planner (view of the data) | ad | multi | none | single | pooled (ad+multi+single, n=150) |
|---|---|---|---|---|---|
| LINCHPIN (fused data, exact cut) | 100% [93%, 100%] | 100% [93%, 100%] | 0% [0%, 7%] | 100% [93%, 100%] | 100% [98%, 100%] |
| - exact cut (greedy only) | 100% [93%, 100%] | 94% [84%, 98%], p = 0.25 | 0% [0%, 7%] | 100% [93%, 100%] | 98% [94%, 99%], p = 0.25 |
| - identity data (scanner + firewall view) | 10% [4%, 21%], p < 1e-4 | 0% [0%, 7%], p < 1e-4 | 0% [0%, 7%] | 100% [93%, 100%] | 37% [29%, 45%], p < 1e-4 |
| - 10% of identity findings | 100% [93%, 100%] | 100% [93%, 100%] | 0% [0%, 7%] | 100% [93%, 100%] | 100% [98%, 100%] |
| - 25% of identity findings | 86% [74%, 93%], p = 0.0156 | 100% [93%, 100%] | 0% [0%, 7%] | 100% [93%, 100%] | 95% [91%, 98%], p = 0.0156 |
| - 50% of identity findings | 74% [60%, 84%], p = 0.000244 | 96% [87%, 99%], p = 0.5 | 0% [0%, 7%] | 100% [93%, 100%] | 90% [84%, 94%], p < 1e-4 |
| - segmentation data (flat network assumed) | 100% [93%, 100%] | 100% [93%, 100%] | 0% [0%, 7%] | 100% [93%, 100%] | 100% [98%, 100%] |
| - exploit semantics (every CVE = RCE) | 100% [93%, 100%] | 100% [93%, 100%] | 0% [0%, 7%] | 100% [93%, 100%] | 100% [98%, 100%] |
| - exploit intel (uniform edge costs) | 100% [93%, 100%] | 100% [93%, 100%] | 0% [0%, 7%] | 100% [93%, 100%] | 100% [98%, 100%] |
| identity data only (BloodHound-style view) | 54% [40%, 67%], p < 1e-4 | 0% [0%, 7%], p < 1e-4 | 0% [0%, 7%] | 0% [0%, 7%], p < 1e-4 | 18% [13%, 25%], p < 1e-4 |
| no graph: KEV then EPSS queue | 2% [0%, 10%], p < 1e-4 | 2% [0%, 10%], p < 1e-4 | 0% [0%, 7%] | 4% [1%, 13%], p < 1e-4 | 3% [1%, 7%], p < 1e-4 |
none has a mean exact min cut of about 7 fixes, so no 3-fix plan can disconnect it; it is excluded from the pooled column, and its rows are compared by attacker cost gain below.
Where identity data can matter. The pooled rate mixes families by design: only ad and multi route through cached credentials (the generator plants them there), while single has no identity edge on its route. Over ad + multi (n=100): fused 100/100 [96%, 100%], without identity data 5/100 [2%, 11%] (exact McNemar p < 1e-4), identity data only 27/100 [19%, 36%]. This is a result inside the generator's model, not a population rate.
Fixes needed on the real graph
Each planner again with a generous budget (12): how many of its fixes, taken in its own order, the real graph needs before every crown jewel is cut off, as a multiple of the exact minimum cut (1.00 = optimal; mean with 95% bootstrap interval). "never" = share of topologies its plan does not disconnect at all. Views that over-approximate the network (flat, every CVE = RCE) always disconnect it eventually, because a cut of a super-graph also cuts the real graph; their cost is extra fixes.
| planner | ad (opt 1.34) | multi (opt 2) | none (opt 7.32) | single (opt 1) |
|---|---|---|---|---|
| LINCHPIN (fused data, exact cut) | 1.00x [1.00, 1.00] | 1.00x [1.00, 1.00] | 1.00x [1.00, 1.00] | 1.00x [1.00, 1.00] |
| - exact cut (greedy only) | 1.01x [1.00, 1.03] | 1.22x [1.14, 1.31] | 1.27x [1.20, 1.35], never 4% | 1.00x [1.00, 1.00] |
| - identity data (scanner + firewall view) | 1.00x, never 90% | n/a, never 100% | 1.00x, never 98% | 1.00x [1.00, 1.00] |
| - 10% of identity findings | 1.00x [1.00, 1.00] | 1.00x [1.00, 1.00] | 1.00x [1.00, 1.00] | 1.00x [1.00, 1.00] |
| - 25% of identity findings | 1.00x [1.00, 1.00], never 14% | 1.00x [1.00, 1.00] | 1.00x [1.00, 1.00], never 80% | 1.00x [1.00, 1.00] |
| - 50% of identity findings | 1.00x [1.00, 1.00], never 26% | 1.00x [1.00, 1.00], never 4% | 1.00x, never 84% | 1.00x [1.00, 1.00] |
| - segmentation data (flat network assumed) | 1.00x [1.00, 1.00] | 1.00x [1.00, 1.00] | 1.00x [1.00, 1.00] | 1.82x [1.72, 1.92] |
| - exploit semantics (every CVE = RCE) | 1.10x [1.02, 1.20] | 1.00x [1.00, 1.00] | 1.09x [1.04, 1.14] | 1.00x [1.00, 1.00] |
| - exploit intel (uniform edge costs) | 1.00x [1.00, 1.00] | 1.00x [1.00, 1.00] | 1.00x [1.00, 1.00] | 1.00x [1.00, 1.00] |
| identity data only (BloodHound-style view) | 1.00x [1.00, 1.00], never 46% | n/a, never 100% | n/a, never 100% | n/a, never 100% |
| no graph: KEV then EPSS queue | 7.58x [6.16, 8.84], never 62% | 4.25x, never 92% | n/a, never 100% | 8.30x [6.90, 9.55], never 60% |
Attacker cost gain where nothing disconnects
Rise of the attacker's cheapest-path cost (edge-cost units) after the 3 fixes, on topologies that stay connected (mean, 95% bootstrap interval, n).
| planner | ad | multi | none | single |
|---|---|---|---|---|
| LINCHPIN (fused data, exact cut) | all disconnected | all disconnected | +0.193 [+0.169, +0.216] (n=50) | all disconnected |
| - exact cut (greedy only) | all disconnected | +0.307 (n=3) | +0.193 [+0.169, +0.216] (n=50) | all disconnected |
| - identity data (scanner + firewall view) | +0.098 [+0.061, +0.140] (n=45) | +0.046 [+0.024, +0.072] (n=50) | +0.142 [+0.117, +0.169] (n=50) | all disconnected |
| - 10% of identity findings | all disconnected | all disconnected | +0.193 [+0.169, +0.216] (n=50) | all disconnected |
| - 25% of identity findings | +0.109 (n=7) | all disconnected | +0.175 [+0.149, +0.200] (n=50) | all disconnected |
| - 50% of identity findings | +0.138 [+0.061, +0.203] (n=13) | +0.141 (n=2) | +0.173 [+0.149, +0.198] (n=50) | all disconnected |
| - segmentation data (flat network assumed) | all disconnected | all disconnected | +0.200 [+0.177, +0.223] (n=50) | all disconnected |
| - exploit semantics (every CVE = RCE) | all disconnected | all disconnected | +0.178 [+0.154, +0.203] (n=50) | all disconnected |
| - exploit intel (uniform edge costs) | all disconnected | all disconnected | +0.049 [+0.029, +0.069] (n=50) | all disconnected |
| identity data only (BloodHound-style view) | +0.000 [+0.000, +0.000] (n=23) | +0.000 [+0.000, +0.000] (n=50) | +0.019 [+0.009, +0.032] (n=50) | +0.000 [+0.000, +0.000] (n=50) |
| no graph: KEV then EPSS queue | +0.101 [+0.067, +0.141] (n=49) | +0.080 [+0.055, +0.108] (n=49) | +0.037 [+0.022, +0.056] (n=50) | +0.078 [+0.051, +0.113] (n=48) |
Exploit intel: paired cost gains
Fused minus uniform-cost planner, on the topologies where neither disconnects (mean, 95% bootstrap interval over the pairs, exact sign test). Intel scoring uses the same CVSS / EPSS / KEV edge costs the uniform planner removed, which favours the fused planner. Uniform scoring scores both plans with uniform costs instead, the uniform planner's own model.
| family | intel scoring | uniform scoring |
|---|---|---|
| none | +0.144 [+0.119, +0.168] (n=50; fused larger in 46, smaller in 3, equal in 1; sign test p < 1e-4) | -0.054 [-0.082, -0.027] (n=50; fused larger in 4, smaller in 20, equal in 26; sign test p = 0.00154) |
How much the exploit intel moves the path ranking
Uniform-cost view vs real costs on the same graph: Kendall tau between the real top-100 paths' real costs and their uniform-view costs, and the overlap of the two top-10 path sets (mean, 95% bootstrap interval).
| family | Kendall tau | top-10 overlap |
|---|---|---|
| ad | 0.51 [0.45, 0.56] | 0.50 [0.43, 0.56] |
| multi | 0.48 [0.41, 0.55] | 0.08 [0.05, 0.12] |
| none | 0.46 [0.39, 0.52] | 0.11 [0.08, 0.15] |
| single | 0.36 [0.29, 0.43] | 0.20 [0.15, 0.25] |
Produced by CI run 37089520295 at commit 0c72593ea68e (4 workers, 547.5 s).
The identity row on real data. The same no_identity view applied to the real-export case study below (public
OpenVAS, Nessus, nmap and SharpHound sample reports in a declared topology; one topology): planned without the
credential and ACL findings, LINCHPIN sees no attack path to the domain controller and proposes no fix, while on the
full graph the domain controller stays reachable (200/200 enumerated paths, k cap 200); the fused plan's one
credential rotation cuts it off (benchmarks/results/case_study.md, commit e26d0b1).
Measured case study (CI lab scan)
The lab-scan CI job starts official Docker images pinned to older releases (httpd 2.4.49, nginx 1.16.1,
tomcat 9.0.30, redis 5.0.7, mysql 5.5.62) on two networks created with --internal, so nothing in them can reach the
internet or the runner's other networks. A scanner container inside each network runs nmap -sV (service/version
detection only; no NSE scripts, no exploitation) against those containers alone. benchmarks/lab_case_study.py
derives hosts, segments and firewall rules from the measurement (app is the only container on both networks),
declares the two facts a scan cannot see (the lp-dmz network faces the internet; db holds the crown jewel), maps
the detected versions to CVEs offline and plans. The job fails if any check below fails. The scans, the derived
topology, the analysis and the pulled image digests below are the artefact of CI run
37091866743 (lab_case_study.json records the run
id and commit); replay with python benchmarks/lab_case_study.py --scans benchmarks/results/lab or
linchpin scenario scenarios/lab_scan.yaml --data-dir ..
Detected by nmap -sV (no scripts): Apache Tomcat 9.0.30, Apache httpd 2.4.49, MySQL 5.5.62, Redis key-value store 5.0.7, nginx 1.16.1.
Offline NVD version-range matching: 5 of 6 services matched, 393 CVEs, 7 of them in CISA KEV. Attack graph: 23 nodes, 36 edges, 10 entry -> crown-jewel paths (k cap 100); crown jewel ds:customer-db.
| vuln node (one per service: upgrade it) | CVSS | EPSS | KEV | code execution |
|---|---|---|---|---|
http_server 2.4.49 (66 CVEs by NVD version range) on web |
9.8 | 0.99992 | yes | yes |
tomcat 9.0.30 (76 CVEs by NVD version range) on app |
9.8 | 0.99927 | yes | yes |
nginx 1.16.1 (7 CVEs by NVD version range) on proxy |
7.7 | 0.53461 | yes | |
mysql 5.5.62 (210 CVEs by NVD version range) on db |
9.1 | 0.82136 | yes | |
redis 5.0.7 (34 CVEs by NVD version range) on cache |
9.9 | 0.82294 | yes |
Chokepoints: vuln:CPE-apache-tomcat-9.0.30@app:8080, vuln:CPE-mysql-mysql-5.5.62@db:3306; exact min cut ['vuln:CPE-mysql-mysql-5.5.62@db:3306'] (one of several minimum cuts: every chokepoint above is a one-node cut). recommend() keeps the greedy pick when it is already a cut of minimum size, preferring the node on the most enumerated paths, then the node id; the MILP may return a different minimum cut of the same size.
| strategy | 1 fix: chosen | cut off? | 3 fixes: cut off? | fixes needed to cut off |
|---|---|---|---|---|
| LINCHPIN (exact cut, else greedy) | vuln:CPE-apache-tomcat-9.0.30@app:8080 |
yes | yes | 1 |
| Exact interdiction MILP (Israeli & Wood 2002) | vuln:CPE-mysql-mysql-5.5.62@db:3306 |
yes | yes | 1 |
| Greedy interdiction (Guo et al.-style) | vuln:CPE-apache-tomcat-9.0.30@app:8080 |
yes | yes | 1 |
| CVSS-first | vuln:CPE-redislabs-redis-5.0.7@cache:6379 |
no | yes | 3 |
| CVSS-first, on-path vulns only | vuln:CPE-redislabs-redis-5.0.7@cache:6379 |
no | yes | 3 |
| EPSS-first | vuln:CPE-apache-http_server-2.4.49@web:80 |
no | yes | 2 |
| EPSS-first, on-path vulns only | vuln:CPE-apache-http_server-2.4.49@web:80 |
no | yes | 2 |
| KEV then EPSS | vuln:CPE-apache-http_server-2.4.49@web:80 |
no | yes | 2 |
| KEV then EPSS, on-path vulns only | vuln:CPE-apache-http_server-2.4.49@web:80 |
no | yes | 2 |
| Betweenness | vuln:CPE-apache-tomcat-9.0.30@app:8080 |
yes | yes | 1 |
LINCHPIN's rationale for its first fix:
tomcat 9.0.30 on app matches 76 CVEs; the one an attacker would use is CVE-2025-24813 (CVSS 9.8, EPSS 0.99927, CISA KEV). It is a step on 10 attack paths; upgrade tomcat 9.0.30 on app (76 known CVEs) breaks 10/10 enumerated attack paths to ds:customer-db.
Checks: no NSE script output in the scans: pass; >= 3 product versions detected: pass; a CISA KEV CVE was mapped: pass; crown jewel reachable before any fix: pass; LINCHPIN's plan cuts the crown jewel off within budget 3: pass; LINCHPIN never needs more fixes than a baseline: pass.
Tools: Nmap version 7.93 ( https://nmap.org ); docker 28.0.4.
Images (tag and the digest that was pulled): httpd:2.4.49 sha256:dcba0d12e2362fb0c50ec524ae8aa1cca4a4ba7216617a57e7bbca20767e79cc; nginx:1.16.1 sha256:d20aa6d1cae56fd17cd458f4807e0de462caf2336f0b70b5eeb69fcaaf30dd9c; tomcat:9.0.30 sha256:cba009c0ef8cec83df8178cf4f4668170bdb02440e4c7c576fc397e477c715d3; redis:5.0.7 sha256:938ee5bfba605cc85f9f52ff95024e9a24cf5511ba6f1cbc68ec9d91a0432125; mysql:5.5.62 sha256:12da85ab88aedfdf39455872fb044f607c32fdc233cd59f1d26769fbf439b045; debian:bookworm-slim sha256:3783cc01769c7b2b1b83a5c5ad96c815348e28ed7da68e2e3687004faa906251.
Scanned and analysed in CI run 37091866743 at commit c5d7c9e6e821.
A version banner is not proof of exposure: backported fixes and configuration are invisible to it, so the CVE lists are an upper bound and the plan is "upgrade these services", not a claim that each CVE is exploitable in the lab.
Real-export case study (declared topology)
Real findings and intel (an OpenVAS scan of Metasploitable 2, a Greenbone report of a Windows Server 2019 host, a
Nessus scan of testphp.vulnweb.com, two nmap exports, and the SharpHound TESTLAB.LOCAL collection including its
ACEs), placed into a declared topology (scenarios/composite_lab.yaml) because the public exports come from
unrelated networks. Crown jewel: the NTDS database on the domain controller.
Findings: 135 = 119 from 6 real exports + 16 from the declared topology overlay (hosts, firewall rules, one service account); 43/69 vuln findings carry a CVE found in NVD (the rest are CVE-less checks) (EPSS 2026-09-25), 2 in CISA KEV. Attack graph: 128 nodes, 224 edges; 69 vuln nodes of which 33 grant code execution; 200 crown-jewel paths enumerated (k cap 200); cheapest path cost 0.422. 3 abusable-ACE nodes: 1 reachable from the entry points, 0 on an enumerated path to the crown jewel. 1 credential uses target hosts the declared firewall rules do not reach (scored with prerequisite_match < 1, contract v1.3). Single-node chokepoints: vuln:NVT-836484@app-win:42, host:app-win, cred:svc_deploy, host:win10.testlab.local, cred:ADMINISTRATOR@TESTLAB.LOCAL. Exact min cut: ['cred:ADMINISTRATOR@TESTLAB.LOCAL'].
With NVD / EPSS / KEV enrichment:
| strategy (budget 3) | fixes chosen | crown jewel cut off? | residual paths (k=200) |
|---|---|---|---|
| LINCHPIN (exact cut, else greedy) | cred:ADMINISTRATOR@TESTLAB.LOCAL |
yes | 0 |
| Exact interdiction MILP (Israeli & Wood 2002) | cred:ADMINISTRATOR@TESTLAB.LOCALcred:svc_deployhost:win10.testlab.local |
yes | 0 |
| Greedy interdiction (Guo et al.-style) | cred:ADMINISTRATOR@TESTLAB.LOCAL |
yes | 0 |
| CVSS-first | vuln:NESSUS-58987@web-php:80vuln:NVT-100111@msf2:512vuln:NVT-103549@msf2:1524 |
no | 200 |
| CVSS-first, on-path vulns only | vuln:NESSUS-58987@web-php:80vuln:NVT-100111@msf2:512vuln:NVT-103549@msf2:1524 |
no | 200 |
| EPSS-first | vuln:NVT-111012@msf2:5432vuln:NESSUS-58988@web-php:80vuln:NVT-103482@msf2:80 |
no | 200 |
| EPSS-first, on-path vulns only | vuln:NESSUS-58988@web-php:80vuln:NVT-103482@msf2:80vuln:NVT-105042@msf2:5432 |
no | 200 |
| KEV then EPSS | vuln:NESSUS-58988@web-php:80vuln:NVT-103482@msf2:80vuln:NVT-111012@msf2:5432 |
no | 200 |
| KEV then EPSS, on-path vulns only | vuln:NESSUS-58988@web-php:80vuln:NVT-103482@msf2:80vuln:NVT-105042@msf2:5432 |
no | 200 |
| Betweenness | vuln:NESSUS-58987@web-php:80vuln:NVT-836484@app-win:42host:app-win |
yes | 0 |
LINCHPIN rationale for its first fix:
Credential ADMINISTRATOR@TESTLAB.LOCAL is recoverable on win10.testlab.local and grants admin on 4 host(s) (primary.testlab.local, testmsa.testlab.local, uccomp.testlab.local, win10.testlab.local); rotate credential ADMINISTRATOR@TESTLAB.LOCAL (remove cached copies) breaks 200/200 enumerated attack paths to ds:ntds@primary.testlab.local.
M11 learned exploitability instead of CVSS/EPSS/KEV: first fix cred:ADMINISTRATOR@TESTLAB.LOCAL, cheapest path cost 0.530.
Identity ablation on this real data (the synthetic ablation's no_identity view): planned without the credential and ACL findings, LINCHPIN sees 0 attack paths and proposes no fix at all; on the full graph that plan does not cut the crown jewel off (200 paths left, k cap 200); even 12 fixes planned from that view never cut it off. The fused plan (cred:ADMINISTRATOR@TESTLAB.LOCAL) cuts it off.
Scanner scores only (no NVD/EPSS/KEV enrichment; 28 vulns grant code execution, cheapest path cost 0.428). Without EPSS data only findings whose export carries an EPSS value can be ranked by EPSS, which is why the EPSS queues differ:
| strategy (budget 3) | fixes chosen | crown jewel cut off? | residual paths (k=200) |
|---|---|---|---|
| LINCHPIN (exact cut, else greedy) | cred:ADMINISTRATOR@TESTLAB.LOCAL |
yes | 0 |
| Exact interdiction MILP (Israeli & Wood 2002) | cred:ADMINISTRATOR@TESTLAB.LOCALcred:svc_deployhost:win10.testlab.local |
yes | 0 |
| Greedy interdiction (Guo et al.-style) | cred:ADMINISTRATOR@TESTLAB.LOCAL |
yes | 0 |
| CVSS-first | vuln:NESSUS-58987@web-php:80vuln:NVT-100111@msf2:512vuln:NVT-103549@msf2:1524 |
no | 200 |
| CVSS-first, on-path vulns only | vuln:NESSUS-58987@web-php:80vuln:NVT-100111@msf2:512vuln:NVT-103549@msf2:1524 |
no | 200 |
| EPSS-first | vuln:NVT-836484@app-win:42vuln:NESSUS-11229@web-php:80vuln:NESSUS-142591@web-php:80 |
yes | 0 |
| EPSS-first, on-path vulns only | vuln:NVT-836484@app-win:42vuln:NESSUS-24907@web-php:80vuln:NESSUS-25971@web-php:80 |
yes | 0 |
| KEV then EPSS | vuln:NVT-836484@app-win:42vuln:NESSUS-58987@web-php:80vuln:NVT-100111@msf2:512 |
yes | 0 |
| KEV then EPSS, on-path vulns only | vuln:NVT-836484@app-win:42vuln:NESSUS-58987@web-php:80vuln:NVT-100111@msf2:512 |
yes | 0 |
| Betweenness | vuln:NESSUS-58987@web-php:80vuln:NVT-836484@app-win:42host:app-win |
yes | 0 |
Computed at commit e26d0b10b3d0.
Reproduction: EPSS vs CVSS (Jacobs et al. 2023)
Reproduction of Jacobs et al., Enhancing Vulnerability Prioritization (IEEE EuroS&PW 2023 / WEIS 2023, arXiv:2302.14172), Figures 3-5. Effort = % of the population flagged; coverage = % of exploited CVEs flagged (recall); efficiency = % of flagged CVEs exploited (precision). Brackets: 95% Wilson interval of that proportion at the fixed threshold. n/r = not reported by the paper. Every paper cell was checked against the arXiv v2 PDF (benchmarks/results/repro_epss_paper_check.md).
Primary: paper-like population, KEV on the scoring date as the label
published <= 2022-12-01, NVD CVSS v3.x, EPSS v2022.01.01 scores of 2022-12-01; label = in KEV on 2022-12-01 (EPSS ingests KEV: circular, optimistic). n = 117,141, exploited = 854 (base rate 0.729%).
| strategy | threshold | effort % | coverage % | efficiency % | paper (effort / coverage / efficiency) |
|---|---|---|---|---|---|
| CVSS 7+ | 7.0 | 58.2 [57.9, 58.5] | 89.6 [87.3, 91.5] | 1.12 [1.05, 1.20] | 58.1 / 82.1 / 3.9 (Fig. 5, 7+) |
| EPSS, coverage matched to CVSS 7+ | 0.0106 | 40.8 [40.5, 41.0] | 90.0 [87.9, 91.9] | 1.61 [1.50, 1.73] | 39.0 / 84.7 / 8.9 (Fig. 5, EPSS v2 0.012+) |
| LINCHPIN blend (no KEV floor), coverage matched | 0.3115 | 68.8 [68.5, 69.0] | 89.6 [87.3, 91.5] | 0.95 [0.89, 1.02] | n/r |
| CVSS 9.1+ | 9.1 | 15.0 [14.8, 15.2] | 31.6 [28.6, 34.8] | 1.53 [1.36, 1.73] | 15.1 / 33.5 / 6.1 (Fig. 4, 9.1+) |
| EPSS, effort matched to CVSS 9.1+ | 0.0161 | 15.1 [14.9, 15.3] | 71.4 [68.3, 74.4] | 3.45 [3.19, 3.73] | 15.4 / 69.9 / 18.5 (Fig. 4, EPSS v2 0.037+) |
Effort ratio EPSS / CVSS 7+ at equal coverage: 0.701 [0.695, 0.824] (class-stratified bootstrap, EPSS threshold re-matched to CVSS 7+'s coverage per replicate, 1,000 replicates, seed 0); the paper's EPSS v2 ratio 0.671 lies outside it (paper, EPSS v3: 0.126, "one-eighth"; paper, EPSS v2: 0.671, at 84.7% vs 82.1% coverage). Coverage gain of EPSS over CVSS 9.1+ at equal effort: +39.8 points (paper: +36.4 with v2, +56.9 with v3).
Paired on the same 854 exploited CVEs, EPSS at CVSS 9.1+'s effort flags 392 that CVSS 9.1+ misses and misses 52 that it flags (218 flagged by both, 192 by neither): exact McNemar p < 1e-4; coverage difference +39.8 points, paired bootstrap 95% [+35.7, +43.9] (10,000 replicates over the exploited CVEs, seed 0).
Prospective: KEV additions in the following year as the label
same population minus CVEs already in KEV; label = added to KEV in (2022-12-01, 2023-12-01] (prospective, few positives). n = 116,287, exploited = 62 (base rate 0.053%).
| strategy | threshold | effort % | coverage % | efficiency % | paper (effort / coverage / efficiency) |
|---|---|---|---|---|---|
| CVSS 7+ | 7.0 | 57.9 [57.7, 58.2] | 77.4 [65.6, 86.0] | 0.07 [0.05, 0.09] | 58.1 / 82.1 / 3.9 (Fig. 5, 7+) |
| EPSS, coverage matched to CVSS 7+ | 0.0089 | n/a (ties) | n/a (ties) | n/a (ties) | 39.0 / 84.7 / 8.9 (Fig. 5, EPSS v2 0.012+) |
| LINCHPIN blend (no KEV floor), coverage matched | 0.3318 | 67.7 [67.5, 68.0] | 77.4 [65.6, 86.0] | 0.06 [0.05, 0.08] | n/r |
| CVSS 9.1+ | 9.1 | 14.9 [14.7, 15.1] | 29.0 [19.2, 41.3] | 0.10 [0.07, 0.16] | 15.1 / 33.5 / 6.1 (Fig. 4, 9.1+) |
| EPSS, effort matched to CVSS 9.1+ | 0.016 | 14.9 [14.7, 15.1] | 53.2 [41.0, 65.1] | 0.19 [0.14, 0.27] | 15.4 / 69.9 / 18.5 (Fig. 4, EPSS v2 0.037+) |
Effort ratio EPSS / CVSS 7+ at equal coverage: not reachable (16 of the 62 exploited CVEs scored at most 0.00885, the most common EPSS value, held by 42% of the population; matching CVSS 7+'s coverage therefore flags almost every CVE) (paper, EPSS v3: 0.126, "one-eighth"; paper, EPSS v2: 0.671, at 84.7% vs 82.1% coverage). Coverage gain of EPSS over CVSS 9.1+ at equal effort: +24.2 points (paper: +36.4 with v2, +56.9 with v3).
Paired on the same 62 exploited CVEs, EPSS at CVSS 9.1+'s effort flags 20 that CVSS 9.1+ misses and misses 5 that it flags (13 flagged by both, 24 by neither): exact McNemar p = 0.00408; coverage difference +24.2 points, paired bootstrap 95% [+9.7, +38.7] (10,000 replicates over the exploited CVEs, seed 0).
Secondary: every CVE to date (the v1 analysis)
every EPSS-scored CVE, EPSS v2026.06.15 of 2026-09-25, CVSS any version; label = in today's KEV (the v1 analysis). n = 379,082, exploited = 1,726 (base rate 0.455%).
| strategy | threshold | effort % | coverage % | efficiency % | paper (effort / coverage / efficiency) |
|---|---|---|---|---|---|
| CVSS 7+ | 7.0 | 50.7 [50.6, 50.9] | 88.8 [87.2, 90.2] | 0.80 [0.76, 0.84] | 58.1 / 82.1 / 3.9 (Fig. 5, 7+) |
| EPSS, coverage matched to CVSS 7+ | 0.0269 | 14.7 [14.6, 14.9] | 88.8 [87.2, 90.2] | 2.74 [2.61, 2.88] | 7.3 / 82.0 / 45.5 (Fig. 5, EPSS v3 0.088+) |
| LINCHPIN blend (no KEV floor), coverage matched | 0.2937 | 71.6 [71.5, 71.8] | 88.8 [87.2, 90.2] | 0.56 [0.54, 0.59] | n/r |
| CVSS 9.1+ | 9.1 | 13.6 [13.5, 13.7] | 35.4 [33.2, 37.7] | 1.19 [1.10, 1.29] | 15.1 / 33.5 / 6.1 (Fig. 4, 9.1+) |
| EPSS, effort matched to CVSS 9.1+ | 0.0291 | 13.6 [13.5, 13.7] | 87.9 [86.3, 89.4] | 2.95 [2.81, 3.10] | 15.3 / 90.4 / 24.1 (Fig. 4, EPSS v3 0.022+) |
Effort ratio EPSS / CVSS 7+ at equal coverage: 0.290 [0.243, 0.363] (class-stratified bootstrap, EPSS threshold re-matched to CVSS 7+'s coverage per replicate, 1,000 replicates, seed 0) (paper, EPSS v3: 0.126, "one-eighth"; paper, EPSS v2: 0.671, at 84.7% vs 82.1% coverage). Coverage gain of EPSS over CVSS 9.1+ at equal effort: +52.5 points (paper: +36.4 with v2, +56.9 with v3).
Paired on the same 1,726 exploited CVEs, EPSS at CVSS 9.1+'s effort flags 942 that CVSS 9.1+ misses and misses 35 that it flags (576 flagged by both, 173 by neither): exact McNemar p < 1e-4; coverage difference +52.5 points, paired bootstrap 95% [+50.0, +55.0] (10,000 replicates over the exploited CVEs, seed 0).
The paper's KEV-list strategy (Fig. 3: effort 0.5%, coverage 5.9%, efficiency 53.2%) has no counterpart here: with KEV as the label it would be tautological.
Provenance: EPSS history v2022.01.01 / 2022-12-01T00:00:00+0000 (sha256 4ede8cf0b188a4e1...), EPSS current v2026.06.15 / 2026-09-25T12:03:13Z, KEV catalog 2026.09.25 (2026-09-25T18:58:16.5029Z), intel cache sha256 55da128b0c4dac17...; code at commit 22b77b5ddb15.
Reading: a partial replication with public data. The paper's population is about 191k CVEs: 118,087 with an NVD CVSS v3 score plus 73,327 v2-only CVEs whose v3 vectors the authors imputed with their own model (p. 4); CVSS 7+ is "58.1% or 110,000 of all published CVEs" (p. 8). We can rebuild only the part that has an NVD v3 score: 117,141 CVEs published by 2022-12-01. On it, with the EPSS scores actually published on that date (model v2022.01.01, i.e. EPSS v2) and KEV as the label, effort reproduces within 2 points in all four rows (58.2% vs 58.1% for CVSS 7+, 40.8% vs 39.0% for EPSS at CVSS 7+ coverage, 15.0% vs 15.1% for CVSS 9.1+, 15.1% vs 15.4% for EPSS at CVSS 9.1+ effort) and coverage within 1.5-7.5 points (CVSS 7+ 89.6% vs 82.1%; the EPSS row is matched to our own ~90% CVSS 7+ coverage, not the paper's 82-85%). The effort ratio at equal coverage, 0.701 [0.695, 0.824], does not include the paper's EPSS v2 value 0.671. Efficiency does not reproduce (1.6% vs 8.9%; 3.4% vs 18.5%) because KEV (854 positives) is a much sparser label than the paper's exploitation telemetry. The paper's headline "one-eighth of the effort" uses EPSS v3, which was not published before March 2023 and cannot be scored retroactively from public data. The paper documents KEV as an input feature of EPSS v3 (Table 1, Fig. 7); for the v2 scores used here that is likely but not documented, so scoring EPSS against KEV on the scoring date may be circular. Against the 62 CVEs added to KEV in the following year (a prospective label), EPSS at CVSS 9.1+'s effort covers 33 and CVSS 9.1+ 18 of the same 62: 20 vs 5 discordant, exact McNemar p = 0.0041, a difference of +24.2 points with a paired bootstrap interval of [9.7, 38.7]. The two marginal Wilson intervals ([41, 65] vs [19, 41]) overlap, which is why the paired test is the right comparison. LINCHPIN's own exploitability blend is a worse global ranker than EPSS (68.8% effort for CVSS 7+ coverage): its job is the edge cost inside a path, not global triage. Every transcribed paper cell was checked against the arXiv v2 PDF (record).
Learned exploitability (M11)
Label: CVE in CISA KEV. Train: NVD CVEs published 2015-01-01..2023-01-01 (n=124,943); test: published >= 2023-01-01 (n=177,922, 691 in KEV, base rate 0.39%). Training positives: 883 with today's catalog, 740 already listed before the cutoff.
Description leakage: 60 test KEV CVEs and 233 non-KEV ones have a description that reports exploitation status ("aware of a report that this issue may have been actively exploited", "in the wild").
95% CIs: class-stratified bootstrap, 200 replicates, seed 0.
v1.0 setup: today's KEV labels, descriptions as published, all test CVEs (n=177,922, 691 KEV):
| scorer | ROC-AUC | average precision |
|---|---|---|
| CVSS base score | 0.748 [0.731, 0.766] | 0.012 [0.011, 0.015] |
| CVSS exploitability sub-score | 0.594 [0.574, 0.617] | 0.006 [0.005, 0.006] |
| LINCHPIN learned (NVD text + vector, no EPSS) | 0.863 [0.850, 0.875] | 0.063 [0.049, 0.080] |
| "exploited in the wild"-style phrase in the description | 0.543 [0.533, 0.554] | 0.021 [0.015, 0.031] |
v1.0 setup: today's KEV labels, descriptions as published, test CVEs without exploitation-status phrases (n=177,629, 631 KEV):
| scorer | ROC-AUC | average precision |
|---|---|---|
| CVSS base score | 0.754 [0.739, 0.772] | 0.011 [0.010, 0.014] |
| CVSS exploitability sub-score | 0.597 [0.572, 0.621] | 0.005 [0.005, 0.006] |
| LINCHPIN learned (NVD text + vector, no EPSS) | 0.851 [0.836, 0.863] | 0.034 [0.028, 0.041] |
| "exploited in the wild"-style phrase in the description | 0.500 [0.500, 0.500] | 0.004 [0.004, 0.004] |
training labels known at the cutoff, all test CVEs (n=177,922, 691 KEV):
| scorer | ROC-AUC | average precision |
|---|---|---|
| CVSS base score | 0.748 [0.731, 0.766] | 0.012 [0.011, 0.015] |
| CVSS exploitability sub-score | 0.594 [0.574, 0.617] | 0.006 [0.005, 0.006] |
| LINCHPIN learned (NVD text + vector, no EPSS) | 0.850 [0.834, 0.863] | 0.059 [0.046, 0.077] |
| "exploited in the wild"-style phrase in the description | 0.543 [0.533, 0.554] | 0.021 [0.015, 0.031] |
training labels known at the cutoff, test CVEs without exploitation-status phrases (n=177,629, 631 KEV):
| scorer | ROC-AUC | average precision |
|---|---|---|
| CVSS base score | 0.754 [0.739, 0.772] | 0.011 [0.010, 0.014] |
| CVSS exploitability sub-score | 0.597 [0.572, 0.621] | 0.005 [0.005, 0.006] |
| LINCHPIN learned (NVD text + vector, no EPSS) | 0.837 [0.820, 0.851] | 0.030 [0.026, 0.036] |
| "exploited in the wild"-style phrase in the description | 0.500 [0.500, 0.500] | 0.004 [0.004, 0.004] |
labels at the cutoff + exploitation-status sentences masked (default), all test CVEs (n=177,922, 691 KEV):
| scorer | ROC-AUC | average precision |
|---|---|---|
| CVSS base score | 0.748 [0.731, 0.766] | 0.012 [0.011, 0.015] |
| CVSS exploitability sub-score | 0.594 [0.574, 0.617] | 0.006 [0.005, 0.006] |
| LINCHPIN learned (NVD text + vector, no EPSS) | 0.838 [0.823, 0.855] | 0.031 [0.027, 0.038] |
| "exploited in the wild"-style phrase in the description | 0.543 [0.533, 0.554] | 0.021 [0.015, 0.031] |
| Edge-cost v1 blend (0.6 CVSS + 0.4 EPSS)* | 0.759 [0.736, 0.781] | 0.299 [0.265, 0.334] |
| FIRST EPSS (reference)* | 0.967 [0.960, 0.972] | 0.376 [0.339, 0.412] |
labels at the cutoff + exploitation-status sentences masked (default), test CVEs without exploitation-status phrases (n=177,629, 631 KEV):
| scorer | ROC-AUC | average precision |
|---|---|---|
| CVSS base score | 0.754 [0.739, 0.772] | 0.011 [0.010, 0.014] |
| CVSS exploitability sub-score | 0.597 [0.572, 0.621] | 0.005 [0.005, 0.006] |
| LINCHPIN learned (NVD text + vector, no EPSS) | 0.836 [0.820, 0.852] | 0.028 [0.024, 0.034] |
| "exploited in the wild"-style phrase in the description | 0.500 [0.500, 0.500] | 0.004 [0.004, 0.004] |
| Edge-cost v1 blend (0.6 CVSS + 0.4 EPSS)* | 0.763 [0.740, 0.785] | 0.302 [0.264, 0.341] |
| FIRST EPSS (reference)* | 0.968 [0.961, 0.974] | 0.376 [0.344, 0.420] |
Default model on the test CVEs without exploitation-status phrases (label and phrase leakage removed; features still come from today's NVD record): average precision 0.028 vs 0.011 for CVSS base score (2.4x; paired bootstrap interval of the ratio in ml_paired.md), ROC-AUC 0.836 vs 0.754.
* uses EPSS scores dated 2026-09-25T12:03:13Z, computed after most test CVEs were exploited and listed; EPSS also ingests exploitation telemetry and the KEV list itself. It is an upper reference, not a fair baseline.
Ranking shift: learned vs static exploitability
The default model replaces the intel exploitability term on the same graphs (budget 3, k=100). Kendall tau compares the static top-100 paths' costs with their learned-model costs; overlap is the share of the static top-10 paths in the learned top-10.
| graph | n | Kendall tau | top-10 overlap | same first fix | same 3-fix plan | learned plan still disconnects |
|---|---|---|---|---|---|---|
| single | 20 | 0.35 | 0.38 | 100% | 100% | 100% |
| multi | 20 | 0.38 | 0.30 | 55% | 55% | 100% |
| none | 20 | 0.41 | 0.38 | 45% | 5% | 0% |
| ad | 20 | 0.62 | 0.67 | 90% | 90% | 100% |
| case study | 1 | 0.32 | 0.70 | yes | yes | yes |
Paired test against CVSS
Paired comparison on the test CVEs without exploitation-status phrases (177,629 CVEs published from 2023-01-01 whose description does not report exploitation, 631 in KEV): the default learned model (reproduces the published ROC-AUC 0.836 and average precision 0.028) against the CVSS base score, both scored on the same class-stratified bootstrap resamples (1,000 replicates, seed 0).
| metric | learned | CVSS base | learned - CVSS (95% paired bootstrap) | ratio (95%) |
|---|---|---|---|---|
| ROC-AUC | 0.836 | 0.754 | +0.082 [+0.065, +0.100] | - |
| average precision | 0.0277 | 0.0114 | +0.0163 [+0.0111, +0.0237] | 2.43x [1.90, 3.24] |
The learned model has the higher ROC-AUC in 100.0% of the replicates. Computed at commit 094ef62cc116.
Neo4j GDS cross-check
The neo4j-gds CI job loads seeded single topologies into Neo4j 5.26.31 Community with the Graph Data Science
2.13.13 plugin (the official image's entrypoint fetches the jar from Neo4j's plugin host), runs
gds.shortestPath.yens from the entry point to the crown jewel, and compares with the NetworkX engine on the same
graph. Each backend is timed 10 times, interleaved (benchmarks/results/gds_crosscheck.json, CI run
37091866743, which the file records). Costs and the
paths strictly cheaper than the k-th agree in every case; the job fails if the plugin is missing.
| hosts | nodes / relationships | k | Yen in NetworkX, median [IQR] | Yen in GDS, median [IQR] | speed-up (medians) | mirror into Neo4j |
|---|---|---|---|---|---|---|
| 250 | 1,131 / 60,040 | 10 | 0.097 s [0.096, 0.098] | 0.020 s [0.016, 0.096] | 4.8x | 7.4 s |
| 250 | 1,131 / 60,040 | 100 | 0.501 s [0.495, 0.539] | 0.062 s [0.054, 0.168] | 8.1x | 5.1 s |
| 500 | 2,246 / 238,665 | 10 | 0.441 s [0.387, 0.448] | 0.011 s [0.011, 0.017] | 39x | 15.3 s |
| 500 | 2,246 / 238,665 | 100 | 1.803 s [1.746, 1.853] | 0.147 s [0.047, 0.225] | 12x | 15.4 s |
GDS timings are noisy on a shared runner (wide interquartile ranges). Across the four CI runs that measured the same sweep (36999203784 and 37016226342 with 3 repeats, 37089503898 and 37091866743 with 10), the median speed-up per setting ranged from 1.4x to 39x and mirroring took 5-23 s. GDS only pays off when the graph already lives in Neo4j: mirroring it costs more than the NetworkX computation it replaces.
Performance
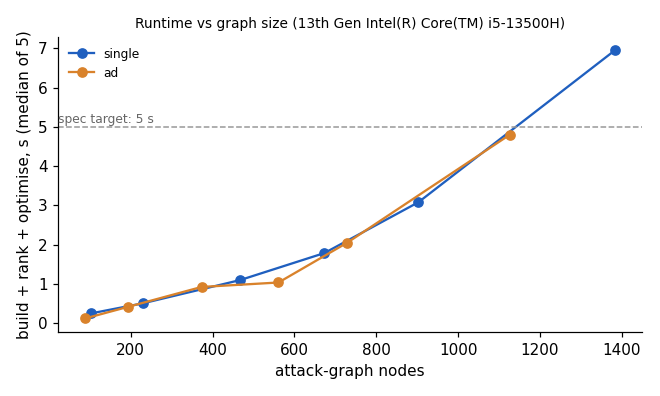
Build + rank (k=10) + optimise (budget 5, k=100), median of 5 runs on an idle laptop (i5-13500H, Python 3.14):
1.10 s at 467 nodes / 9.8k edges (single) and 0.92 s at 373 nodes (ad), so the spec's "< 5 s at 500 nodes" holds;
3.1 s at 903 nodes, 7.0 s at 1,384 nodes / 89k edges. The optimiser time includes one exact min cut; a standalone
min cut takes 0.2-1.6 s in this range. These are one session's medians (benchmarks/results/scale.json, committed in
bbf492e, with the platform and command); laptop timings vary between sessions, and no other session's raw timings are
committed, so no figure for that variation is given.
Threats to validity
- Synthetic families are the project's own. Their structure (bastions, parallel pivots, flat networks, AD tiers) decides how often a small cut exists. Results transfer to real networks only as far as these shapes do.
- Scored inside the model. Disconnection and cost are computed on LINCHPIN's attack graph with its edge costs; a real attacker is not bound by them. The ablation and the measured lab partly address this, the declared case study does not.
- The identity result is designed into the families. Only
adandmultiroute through cached credentials (by construction of the generator), so "without identity data 5/100" is a statement about those families inside the model, and the pooled 37% depends on the family mix. The real-export case study repeats the comparison on real data (one topology). - Planted distractors inflate how badly the plain score queues do; the on-path variants remove that advantage. The action spaces still differ (queues only patch), so the best patch-only plan (95% [90, 97]) is the like-for-like ceiling for them.
- Exploit-intel costs are scored with themselves. The uniform-cost ablation plans without CVSS / EPSS / KEV but is
scored with them, which favours the fused planner (+0.144 [0.119, 0.168] on
none); scored with uniform costs the order reverses (-0.054 [-0.082, -0.027]). Neither scoring is ground truth, so the ablation does not show that exploit intel improves plans against a real attacker. - KEV is a proxy label (for the reproduction and M11): a small, curated subset of exploitation in the wild.
- The reproduction covers part of the paper's population (117,141 of about 191k CVEs; the paper imputed v3 vectors for 73,327 v2-only CVEs) with a different label, so it is a partial replication.
- The measured lab is small (5 containers, 2 networks) and its CVE lists come from version banners.
- Residual paths are capped at k, so the residual metric saturates on dense graphs; disconnect rate and cost gain do not.