Evaluation
Every number on this page is rendered from committed JSON by scripts/render_tables.py
(the tables below are results/TABLES.md; each table names its source file and the run that
wrote it). How to regenerate each file is on Reproduce. The short version of
the findings:
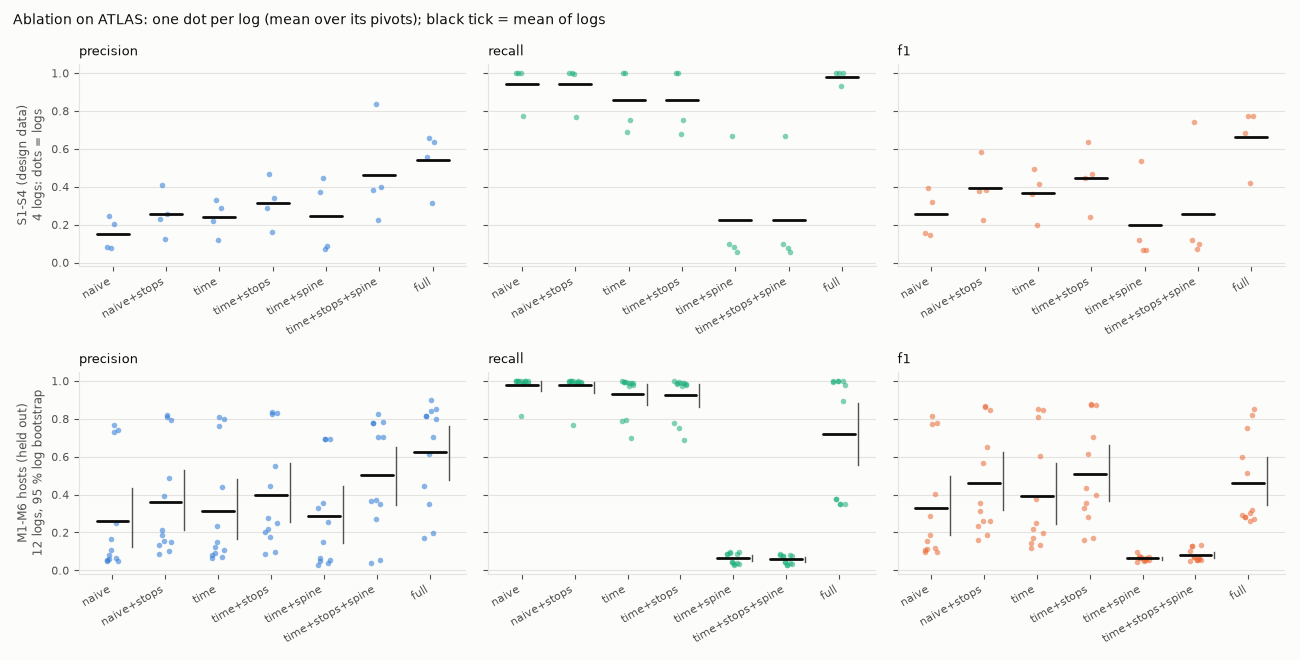
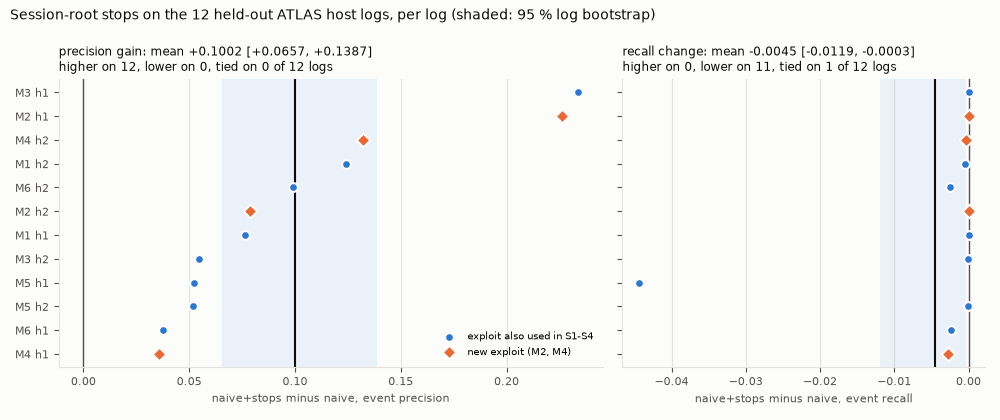
- Reconstruction (ATLAS). On the four scenarios the traversal was designed on, the full method beats naive reachability on every log (event F1 0.66 vs 0.25; ΔF1 +0.41, t(3) 95 % CI [0.24, 0.58]). On the 12 held-out M1-M6 host logs it is 2.4x more precise (0.62 vs 0.26), but recall drops to 0.72 and the F1 gain is not significant (higher on 9 of 12 logs, sign-flip p = 0.28). Session-root stops are the component that transfers: precision is higher on 12 of 12 held-out logs (+0.10 [0.07, 0.14], exact sign test p = 0.0005) with recall essentially unchanged (-0.0045 [-0.012, -0.0003]). The held-out logs are unseen host logs from the same testbed, and 8 of 12 replay an S1-S4 exploit; on the four logs with a new exploit (M2, M4) the stops add +0.12 precision, higher on 4 of 4.
- Comparison with the paper. ROOTLINE's naive reachability lands where ATLAS's own published graph-traversal baseline does (P 0.15-0.26 vs 0.18). Our PyTorch reproduction of the ATLAS LSTM does not reach the published entity-level numbers, nor ATLAS's own cleaned list scored the same way (0.86-1.00); ATLAS's shipped raw model output does not either.
- Rules. v0.3 detects 23/27 in-sample
dev2captures but 4/64 parsed sealed captures (Wilson [0.02, 0.15]). The rules do not generalise; 96 of 160 sealed captures are not even parsed. - Unsupervised ranking. IsolationForest does not outperform a one-line "user-dir image first" heuristic on the held-out hosts (recall@10 0.78 vs 0.93; the heuristic is higher on 8, lower on 1 and tied on 3 of 12 logs, sign test p = 0.039) and falls to 0.49 without that single feature.
- Live kernel. The probe recovers the scripted chain on a real kernel in CI in one query,
with the download socket as a root cause, in 72 of 72 completed jobs over 15 pushes (71 of
72 jobs pass every check; one row per job in
results/live_ebpf.json).
Methodology
Data. ATLAS (Alsaheel et al., USENIX Security 2021) ships pre-processed Windows audit,
DNS and browser logs where every line is labelled + when it involves a ground-truth
attack entity. ROOTLINE uses the audit and DNS rows (browser rows have no pid); a raw event
is an attack event when its line is +. Events are predicted when both endpoints
of their provenance edge are in the story. DNS events are not scored.
Pivots. One run per (log, pivot): ATLAS's own starting IOC (user_artifact.txt)
and every ground-truth entity that maps to a vertex (the paper's random-symptom protocol).
Entity recall counts ground-truth entities found other than the ones the pivot itself
covers. Root-cause hit@3 asks whether any of the three top-ranked entry points is a
ground-truth entity.
Design vs held-out data. The v0.2 traversal heuristics (Windows session roots, the
browser-profile penalty, the user-dir anomaly feature) were written while looking at
S1-S4, so S1-S4 results are in-sample. The per-host logs of M1-M6 were never used for
design. See ADR 0010.
Statistics. Means are means of per-log means, and the log is the unit of every test,
because pivots in one log share a graph and are not independent. For the 12 held-out logs,
intervals are 95 % percentile intervals from a log-cluster bootstrap (2,000 resamples), and
paired differences against naive get exact two-sided sign and sign-flip tests over logs; the
smallest attainable p with 12 logs is 2/2^12 = 0.00049. For the four S logs, a bootstrap
cannot extend past the extreme logs and no distribution-free test can go below p = 0.125, so
the tables give the range over the four logs and a t(3) interval for the difference. Pivot
counts are reported as description only. p-values are stored to 4 significant digits and never
printed as 0. Rule coverage uses Wilson intervals computed from the counts. IsolationForest's
per-log value is the mean over 10 seeds.
Variants. Each switches components of the same reconstructor off:
| variant | time-respecting | session-root stops | causal spine | accessed expansion |
|---|---|---|---|---|
| naive | ||||
| naive+stops | yes | |||
| time | yes | |||
| time+stops | yes | yes | ||
| time+spine | yes | yes | ||
| time+stops+spine | yes | yes | yes | |
| full (ROOTLINE) | yes | yes | yes | yes |
Generated by python scripts/render_tables.py from the committed JSON in results/. Do not edit by hand.
Headline results
| Result | Number | Source (results/) |
|---|---|---|
| ATLAS S1-S4 (design data): full method vs naive reachability, event F1 | 0.66 vs 0.25, higher on 4 of 4 logs (per-log 0.42-0.78 vs 0.15-0.39; ΔF1 +0.41, t(3) 95 % CI [+0.24, +0.58]) | ablation.json, bench run 37092501921 |
| ATLAS M1-M6 host logs (held out): precision / recall / F1, full vs naive | 0.62 / 0.72 / 0.46 vs 0.26 / 0.98 / 0.33; F1 higher on 9 of 12 logs, ΔF1 +0.14 [-0.11, +0.35] (sign-flip p = 0.28, not significant) | ablation.json, bench run 37092501921 |
| Session-root stops alone, held out | precision +0.10 [+0.07, +0.14], higher on 12 of 12 logs (exact sign test p = 0.00049); recall -0.0045 [-0.0119, -0.0003] | ablation.json, bench run 37092501921 |
| Same, only the 4 held-out logs whose exploit is not in S1-S4 (M2, M4) | precision +0.12, higher on 4 of 4 logs (descriptive) | ablation.json, bench run 37092501921 |
| ATLAS paper's graph-traversal baseline vs ROOTLINE naive reachability, event precision | 0.18 vs 0.15 / 0.26: consistent | paper Table 5; ablation.json, bench run 37092501921 |
| ATLAS LSTM, our reproduction (entity F1, S1-S4, mean of 5 seeds) | 0.24-0.75 vs ATLAS's cleaned list under our scorer 0.86-1.00 (paper 0.89-1.00): not reproduced | atlas_repro.json, atlas-repro run 36997669262 |
| Rule tagger v0.3: in-sample dev2 vs sealed, captures detected | 23/27 [0.68, 0.94] vs 4/64 [0.02, 0.15] | coverage.json, sealed-coverage run 36994398382 |
| Live bpftrace probe on a GitHub-hosted kernel | 71/72 CI jobs pass over 15 pushes [0.925, 0.998]; chain recovered in one query in 72/72 [0.95, 1.00] | live_ebpf.json, ci runs 36996901332..37003827535 |
| Graph reduction (16 ATLAS logs) | 3.8-5.8x fewer edges, lossless by design | atlas.json, bench run 37092501921 |
Ablation (ATLAS, every ground-truth entity as a pivot)
ATLAS S1-S4, design data (in-sample): 4 logs, 15 pivots (results/ablation.json, bench run 37092501921). Mean of per-log means with the range over the four logs in brackets. Four logs are too few for a useful interval per variant (a 4-log bootstrap cannot extend past the extreme logs) or for a distribution-free test (the smallest attainable exact p is 0.125); the ΔF1 column gives a t(3) 95 % interval.
| variant | precision (range) | recall (range) | F1 (range) | root-cause hit@3 | story vertices | ΔF1 vs naive [t(3) 95 % CI] | logs with higher precision |
|---|---|---|---|---|---|---|---|
| naive | 0.15 (0.08-0.25) | 0.94 (0.78-1.00) | 0.25 (0.15-0.39) | 0.50 | 5,494 | ||
| naive+stops | 0.26 (0.13-0.41) | 0.94 (0.770-0.9999) | 0.39 (0.22-0.58) | 0.50 | 4,416 | +0.14 [+0.01, +0.26] | 4/4 |
| time | 0.24 (0.12-0.33) | 0.86 (0.69-1.00) | 0.37 (0.20-0.49) | 0.45 | 3,520 | +0.11 [+0.01, +0.22] | 4/4 |
| time+stops | 0.31 (0.16-0.46) | 0.86 (0.677-0.9999) | 0.45 (0.24-0.63) | 0.45 | 3,291 | +0.19 [+0.05, +0.33] | 4/4 |
| time+spine | 0.24 (0.07-0.45) | 0.23 (0.06-0.67) | 0.20 (0.06-0.53) | 0.45 | 919 | -0.06 [-0.32, +0.20] | 2/4 |
| time+stops+spine | 0.46 (0.22-0.84) | 0.22 (0.05-0.67) | 0.26 (0.07-0.74) | 0.45 | 400 | +0.002 [-0.39, +0.39] | 4/4 |
| full | 0.54 (0.31-0.66) | 0.98 (0.931-0.9995) | 0.66 (0.42-0.78) | 0.45 | 3,139 | +0.41 [+0.24, +0.58] | 4/4 |
Per-log F1, full vs naive: S1 0.68 vs 0.15; S2 0.77 vs 0.39; S3 0.42 vs 0.15; S4 0.78 vs 0.32 (higher on 4 of 4 logs, paired t(3) = 7.48, p = 0.0049).
ATLAS M1-M6 host logs, held out: 12 logs, 40 pivots (results/ablation.json, bench run 37092501921). Mean of per-log means, 95 % log-cluster bootstrap. Paired tests are over logs (pivots in one log share a graph); with 12 logs the smallest attainable exact p is 0.00049.
| variant | precision | recall | F1 | entity recall | root-cause hit@3 | story vertices | ΔF1 vs naive | logs with higher precision |
|---|---|---|---|---|---|---|---|---|
| naive | 0.26 [0.12, 0.43] | 0.98 [0.950, 0.998] | 0.33 [0.19, 0.50] | 0.98 [0.93, 1.00] | 0.42 | 5,869 | ||
| naive+stops | 0.36 [0.21, 0.53] | 0.98 [0.938, 0.997] | 0.46 [0.32, 0.62] | 0.98 [0.93, 1.00] | 0.50 | 4,550 | +0.14 [+0.09, +0.18]; 12/12 logs, sign-flip p = 0.00049 | 12/12 (sign test p = 0.00049) |
| time | 0.31 [0.16, 0.48] | 0.93 [0.87, 0.99] | 0.39 [0.24, 0.56] | 0.97 [0.92, 1.00] | 0.40 | 4,730 | +0.07 [+0.04, +0.09]; 12/12 logs, sign-flip p = 0.00049 | 12/12 (sign test p = 0.00049) |
| time+stops | 0.40 [0.25, 0.57] | 0.93 [0.86, 0.98] | 0.51 [0.37, 0.66] | 0.97 [0.92, 1.00] | 0.48 | 3,921 | +0.18 [+0.12, +0.24]; 12/12 logs, sign-flip p = 0.00049 | 12/12 (sign test p = 0.00049) |
| time+spine | 0.28 [0.15, 0.45] | 0.06 [0.05, 0.08] | 0.06 [0.06, 0.07] | 0.97 [0.92, 1.00] | 0.40 | 321 | -0.26 [-0.44, -0.12]; 0/12 logs, sign-flip p = 0.00049 | 5/12 (sign test p = 0.77) |
| time+stops+spine | 0.50 [0.35, 0.65] | 0.06 [0.05, 0.07] | 0.08 [0.07, 0.10] | 0.97 [0.92, 1.00] | 0.48 | 183 | -0.25 [-0.43, -0.10]; 2/12 logs, sign-flip p = 0.0063 | 8/12 (sign test p = 0.39) |
| full | 0.62 [0.48, 0.76] | 0.72 [0.56, 0.88] | 0.46 [0.35, 0.60] | 0.97 [0.92, 1.00] | 0.48 | 2,576 | +0.14 [-0.11, +0.35]; 9/12 logs, sign-flip p = 0.28 | 12/12 (sign test p = 0.00049) |
Session-root stops alone (naive+stops vs naive), held out: precision +0.10 [+0.07, +0.14], higher on 12 of 12 logs (exact sign test p = 0.00049; 33 of 40 pivots higher, 1 lower); recall -0.0045 [-0.0119, -0.0003], lower on 11 of 12 logs (1 tied).
Highest held-out F1 point estimate: time+stops 0.51 vs full 0.46; difference +0.04 [-0.14, +0.26], higher on 5 of 12 logs (sign-flip p = 0.69), so it is the highest point estimate, not a significant winner. Root-cause hit@3 ranges 0.40-0.50 over all variants and both groups.
The held-out logs are unseen host logs from the same ATLAS testbed; 8 of the 12 replay an exploit that one of S1-S4 also uses (the CVE is in each log's name). The strictest check of the claim is the two multi-host attacks with a new exploit (descriptive, 4 logs):
| held-out logs | logs | Δ precision (mean) | Δ precision (range) | logs higher | Δ recall (mean) |
|---|---|---|---|---|---|
| exploit not in S1-S4 (M2, M4) | 4 | +0.118 | +0.036 to +0.226 | 4/4 | -0.0008 |
| exploit also used in S1-S4 (M1, M3, M5, M6) | 8 | +0.091 | +0.038 to +0.234 | 8/8 | -0.0062 |
ATLAS from the analyst IOC (one pivot per log)
| scenarios | method | logs | precision | recall | F1 | story vertices |
|---|---|---|---|---|---|---|
| M (held out) | ioc-grep | 12 | 0.999 [0.998, 1.000] | 0.034 [0.027, 0.042] | 0.065 [0.053, 0.080] | 5 |
| M (held out) | naive-bfs | 12 | 0.154 [0.095, 0.228] | 0.998 [0.996, 0.999] | 0.250 [0.166, 0.350] | 6,308 |
| M (held out) | rootline | 12 | 0.673 [0.479, 0.857] | 0.597 [0.353, 0.837] | 0.360 [0.196, 0.541] | 2,149 |
| S1-S4 (in-sample) | ioc-grep | 4 | 0.998 (0.992-1.000) | 0.040 (0.017-0.079) | 0.077 (0.033-0.146) | 8 |
| S1-S4 (in-sample) | naive-bfs | 4 | 0.161 (0.079-0.244) | 0.9995 (0.999-1.000) | 0.269 (0.146-0.392) | 5,902 |
| S1-S4 (in-sample) | rootline | 4 | 0.408 (0.161-0.590) | 0.999 (0.9957-0.9999) | 0.559 (0.277-0.742) | 3,424 |
Source: results/atlas.json, bench run 37092501921. Means over logs; held-out rows give a 95 % log bootstrap, in-sample rows the range over the four logs. rootline-noreduce rows in the JSON are identical to rootline (reduction is lossless by design) and are not shown.
Comparison with published ATLAS results
| system | level | trained on labels | precision | recall | F1 |
|---|---|---|---|---|---|
| ATLAS paper, Table 5: graph traversal (10 attacks) | event | no | 0.178 | 1.000 | 0.303 |
| ROOTLINE naive reachability (S1-S4 / M hosts, all pivots) | event | no | 0.153 / 0.261 | 0.943 / 0.981 | 0.254 / 0.327 |
| ROOTLINE full (S1-S4 / M hosts, all pivots) | event | no | 0.542 / 0.625 | 0.982 / 0.722 | 0.663 / 0.463 |
| ATLAS paper, Table 4: LSTM (10 attacks) | event | yes | 0.999 | 0.999 | 0.999 |
ATLAS LSTM reproduction, entity level (results/atlas_repro.json, atlas-repro run 36997669262). Our scorer counts ROOTLINE's abstracted entity set, which is about a tenth of the paper's; the like-for-like reference is therefore ATLAS's own cleaned list scored by our scorer, not the paper's number. ATLAS's released evaluate.py scores a manually entered cleaned list (the script stops until one is filled in); for S1 the shipped list equals the ground truth.
| scenario | entities in paper Table 4 (malicious) | entities under our scorer (malicious) | paper F1 | ATLAS cleaned list, our scorer | ATLAS shipped raw output, our scorer | our LSTM, regenerated training set: mean (5-seed range) | our LSTM, ATLAS's shipped training set: mean (5-seed range) |
|---|---|---|---|---|---|---|---|
| S1 | 7,467 (22) | 652 (11) | 1.00 | 1.00 | 0.71 | 0.65 (0.48-0.80) | 0.75 (0.43-0.95) |
| S2 | 34,022 (12) | 2,162 (7) | 0.92 | 0.88 | 0.70 | 0.50 (0.22-0.74) | 0.60 (0.33-0.93) |
| S3 | 8,998 (26) | 752 (19) | 0.96 | 0.94 | 0.39 | 0.30 (0.05-0.54) | 0.54 (0.40-0.81) |
| S4 | 13,037 (21) | 897 (16) | 0.89 | 0.86 | 0.33 | 0.40 (0.17-0.58) | 0.24 (0.14-0.40) |
Event universe: what ROOTLINE can score vs what ATLAS labels
| log | ROOTLINE events | ATLAS '+' lines | scored attack events | ratio |
|---|---|---|---|---|
| M1 h1 (CVE-2015-5122) | 68,307 | 4,011 | 2,942 | 0.73 |
| M1 h2 (CVE-2015-5122) | 76,490 | 4,157 | 3,039 | 0.73 |
| M2 h1 (CVE-2015-5119) | 81,766 | 17,875 | 11,514 | 0.64 |
| M2 h2 (CVE-2015-5119) | 81,624 | 17,081 | 11,152 | 0.65 |
| M3 h1 (CVE-2015-3105) | 76,081 | 18,094 | 11,700 | 0.65 |
| M3 h2 (CVE-2015-3105) | 89,799 | 17,092 | 11,146 | 0.65 |
| M4 h1 (CVE-2018-8174) | 77,635 | 4,091 | 2,984 | 0.73 |
| M4 h2 (CVE-2018-8174) | 67,792 | 4,145 | 3,026 | 0.73 |
| M5 h1 (CVE-2017-0199) | 214,035 | 17,126 | 11,146 | 0.65 |
| M5 h2 (CVE-2017-0199) | 75,423 | 17,049 | 11,125 | 0.65 |
| M6 h1 (CVE-2017-11882) | 84,581 | 5,803 | 4,097 | 0.71 |
| M6 h2 (CVE-2017-11882) | 89,866 | 4,191 | 3,048 | 0.73 |
| S1 (CVE-2015-5122) | 53,538 | 4,598 | 3,363 | 0.73 |
| S2 (CVE-2015-3105) | 50,390 | 15,073 | 9,519 | 0.63 |
| S3 (CVE-2017-11882) | 68,835 | 5,165 | 3,689 | 0.71 |
| S4 (CVE-2017-0199) | 71,044 | 18,062 | 11,624 | 0.64 |
Unsupervised process ranking (ATLAS)
| logs | ranking | n | first malicious process at rank | recall@10 |
|---|---|---|---|---|
| M (held out) | iforest | 12 | 1.87 [1.76, 1.99] | 0.776 [0.644, 0.893] |
| M (held out) | iforest-no-userdir | 12 | 2.33 [2.10, 2.61] | 0.493 [0.436, 0.547] |
| M (held out) | user-dir image first (heuristic) | 12 | 1.00 [1.00, 1.00] | 0.929 [0.786, 1.000] |
| M (held out) | degree | 12 | 5.08 [2.92, 7.00] | 0.327 [0.261, 0.397] |
| S1-S4 (in-sample) | iforest | 4 | 1.75 (1.10-2.00) | 0.863 (0.667-1.000) |
| S1-S4 (in-sample) | iforest-no-userdir | 4 | 2.40 (1.90-3.30) | 0.667 (0.500-1.000) |
| S1-S4 (in-sample) | user-dir image first (heuristic) | 4 | 1.00 (1.00-1.00) | 0.833 (0.333-1.000) |
| S1-S4 (in-sample) | degree | 4 | 4.25 (1.00-8.00) | 0.500 (0.167-1.000) |
Source: results/atlas.json, bench run 37092501921. IsolationForest per log is the mean over 10 seeds. Held-out rows give a 95 % log bootstrap, in-sample rows the range over the four logs.
| held-out recall@10, paired over 12 logs | mean difference [t(11) 95 % CI] | logs higher / lower / tied | exact sign test |
|---|---|---|---|
| user-dir heuristic minus IsolationForest | +0.15 [-0.02, +0.33] | 8 / 1 / 3 | p = 0.039 |
| IsolationForest minus IsolationForest without exec_user_dir | +0.28 [+0.14, +0.42] | 10 / 0 / 2 | p = 0.002 |
Rule coverage, Splunk attack_data (v0.3 rules)
| split | captures | unparsed | v0.3 detected [Wilson 95 %] | v0.3 same technique [Wilson 95 %] | alert precision proxy: on-technique / all alerts |
|---|---|---|---|---|---|
| dev | 46 | 1 | 34/45 [0.61, 0.86] | 27/45 [0.45, 0.73] | 84/105 [0.71, 0.87] |
| dev2 | 27 | 0 | 23/27 [0.68, 0.94] | 14/27 [0.34, 0.69] | 61/166 [0.30, 0.44] |
| sealed | 160 | 96 | 4/64 [0.02, 0.15] | 1/64 [0.003, 0.083] | 1/5 [0.04, 0.62] |
| sealed-unseen-technique | 73 | 45 | 2/28 [0.02, 0.23] | 0/28 [0.00, 0.12] | 0/2 [0.00, 0.66] |
| sealed-excluding-v03-target-techniques (derived, see note) | 117 | 66 | 3/51 [0.02, 0.16] | 1/51 [0.003, 0.103] | - |
Source: results/coverage.json, sealed-coverage run 36994398382 at 60e3561 (scored once; never re-scored). Wilson intervals are computed here from the counts. The alert-precision interval treats alerts as independent, but alerts cluster within captures, so it is too narrow. The derived row excludes sealed captures whose parent technique a v0.3 rule names (rootline.bench.sealed_excluding_v03_targets); it was added after the scoring run, computed from that run's committed rows, and does not appear in the run's own artefact.
Live eBPF in CI
| CI evidence | jobs passed [Wilson 95 %] | chain recovered [Wilson 95 %] | root causes (one query) | story vertices | alerts | lost events |
|---|---|---|---|---|---|---|
| run 36996901332 (0e86829; run conclusion failure: lint failed, live-ebpf 5/5) | 5/5 [0.57, 1.00] | 5/5 | /tmp/rootline-lab-stage.sh, 198.51.100.7:8081 | 28 | RL-002, RL-003, RL-004, RL-005, RL-006, RL-007 | 0 |
| repeatability: 15 push runs on main, 36996901332..37003827535 (0e86829..2aad2d0) | 71/72 [0.925, 0.998] | 72/72 [0.95, 1.00] | /tmp/rootline-lab-stage.sh, 198.51.100.7:8081 | 28-54 | same in every job | 0 |
Source: results/live_ebpf.json; one row per job in repeatability.jobs, collected from the CI artefacts by scripts/live/collect_repeatability.py. Cancelled jobs (3) are excluded. The one failure: run 36998054457 matrix 4 (fork-parent check, since corrected; chain recovered). Dependabot-branch runs in the same period (not in the window): 10 runs (36998921068, 36998925449, 36998932197, 36998938464, 36999002032, 36999006264, 36999007966, 36999011841, 36999025961, 36999031176), 50/50 live-ebpf jobs passed.
Reading the comparison with published work
- Event universe. ROOTLINE scores 63-73 % of the lines ATLAS labels as attack (table
above): browser rows, pid-less rows and audit lines that carry no file or network
operation have no syscall-level event. A recall measured against all
+lines would be lower by that factor. ATLAS's own attack-event counts (Table 3) equal the+line counts for 9 of the 10 attacks; for M-3 the+lines number 35,186 against Table 3's 34,979. - Starting entity. The paper's Table 4 starts S-1, S-3, M-5 and M-6 from a malicious host, S-2, S-4, M-1 and M-2 from a leaked file, and M-3 and M-4 from a malicious file. ROOTLINE's IOC runs start from the attacker address, and the ablation uses every entity.
- Same campaigns. The paper's Table 2 builds S-1/M-1, S-2/M-3, S-3/M-6 and S-4/M-5 from the same APT reports and exploits; only M-2 (CVE-2015-5119) and M-4 (CVE-2018-8174) are new. The ablation therefore reports the M2/M4 logs separately.
- Training. ATLAS trains leave-one-attack-out on labelled sequences; ROOTLINE uses no
labels. ATLAS's released
evaluate.pyscores a manually entered cleaned entity list (the script stops until one is filled in); the shippedeval_*.jsonfiles contain such a list, and for S1 it equals the ground truth exactly. Scored without that list, ATLAS's own raw model output gives entity F1 0.71 / 0.70 / 0.39 / 0.33 on S1-S4. - Entity universe. Our scorer counts ROOTLINE's abstracted entities (652 for S1, 11 of them malicious), the paper's Table 4 counts 7,467 (22 malicious). The like-for-like reference for our reproduction is therefore ATLAS's own cleaned list under our scorer (F1 0.86-1.00), not the paper's 0.89-1.00.
- Our LSTM reproduction (
repro/atlas_repro.py, PyTorch, 5 seeds, run in the manualatlas-reproworkflow) follows ATLAS's released code (batch 1 and 8 epochs as in itsatlas.py, sequence length 400). Mean entity F1 per scenario is 0.30-0.65 with a regenerated training set and 0.24-0.75 with ATLAS's shipped training set; the 5-seed ranges are in the table above. Differences that may explain the gap: Keras vs PyTorch initialisation, rapidfuzz vs fuzzywuzzy in undersampling, and the manual cleaning step. The paper's numbers are not reproduced. - Graph-traversal baseline. The paper's Table 5 traversal baseline (P 0.18, R 1.00) and ROOTLINE's naive reachability (P 0.15 on S1-S4, 0.26 on M hosts) agree, which is a useful check that the event universes are comparable at least for traversal methods.
Reduction
The reduction is lossless for causality by construction: it merges repeated edges only when
no new information reached the source in between, and keeps the first edge of every
(source, target, relation) key. "100 % of attack edges preserved" is therefore a property of
the design, not an empirical finding. The empirical check is that stories with and without
reduction are identical (rootline vs rootline-noreduce in the raw tables). On ATLAS it
removes 3.8-4.35x of the edges on S1-S4 and 3.8-5.81x across all 16 logs; vertex counts do not change.
Raw tables
The full per-scenario tables (including IsolationForest ranking and the per-capture coverage rows) are on Raw benchmark tables.