Evaluation
All numbers come from benchmarks/*.py on ATT&CK v19.2 (697 techniques), CIS v8 (153
safeguards), NIST SP 800-53 rev5 (109 mapped controls), six more CTID Mappings Explorer
frameworks and SigmaHQ r2026-07-01 (2,877 rules over 116 log sources). The tables below are
included verbatim from results/*.md, which the scripts regenerate. Each results file ends with
the GitHub Actions run and commit that produced it, and the matching results/*.json holds the
same in its provenance block.
Exact commands, expected outputs and measured runtimes are on the Reproduce page.
Randomness is seeded everywhere (synthetic orgs: seeds 0-24 per maturity level; random mapping
baseline: 10 seeds; bootstraps and permutation tests: seed 0). Only timings vary between runs;
scripts/check_results.py checks that.
Methodology
Statuses. A technique is claimed if a claimed control maps to it, detectable if a deployed Sigma rule tagged with it has all of its log sources ingested, and defended if both hold. Percentages are over the 697 ATT&CK v19.2 (sub-)techniques. Parents and sub-techniques are scored separately.
What "defended" measures. A control mapping says a safeguard could mitigate or detect a technique; most mapped CIS safeguards are Protect-function controls. "Defended" therefore means detection-backed coverage. A technique claimed only by preventive controls is counted as paper-only even though it may be blocked; the ablation below reports how many such techniques there are, so the gap is not read as exposure.
Telemetry tiers (cumulative; patterns are matched against the Sigma log-source ids):
| tier | adds |
|---|---|
| T0 | windows/security, windows/system, windows/application |
| T1 | PowerShell: windows/ps_script, windows/ps_module, windows/powershell-classic, windows/ps_classic_* |
| T2 | Sysmon/EDR-class Windows categories (process_creation, registry_*, file_*, image_load, network_connection, dns_query, process_access, ...) |
| T3 | cloud and identity audit: aws/*, azure/*, gcp/*, m365/*, okta/*, github/*, google_workspace/*, onelogin/* |
| T4 | proxy, dns, firewall, webserver, zeek/*, linux*, macos/*, antivirus |
| T5 | every Sigma log source (116) |
Profiles. Deterministic profiles claim every control up to a CIS Implementation Group, an SP
800-53B baseline, or every mapped control of a CTID framework. They deploy every stable and
test Sigma rule (2,614 of 2,877). Synthetic orgs (vantage.synth.random_org, seeds 0-24 per
level) draw each item independently at maturity m (0.2, 0.4, 0.6, 0.8): claim a control with
probability 0.4 + 0.6m, ingest a log source with 0.2 + 0.7m, and deploy a rule with 0.3 + 0.6m.
Claims are deliberately inflated relative to telemetry, to model the paper-vs-real gap.
Auto-mapping metrics. For each control with at least one gold technique, the mapper ranks techniques. P@k is the share of the top k that are gold, R@k is the share of gold found in the top k, and AP@200 is average precision to depth 200, normalised by min(|gold|, 200). Values are macro-averaged over controls (MAP@200). Label-using mappers are scored leave-one-control-out; in-framework transfer is nested leave-one-out.
Intervals and tests. Auto-mapping uses 95% percentile bootstraps over controls (1,000
resamples, seed 0). Differences between mappers are paired over the same controls: a paired
bootstrap interval (2,000 resamples) and a two-sided sign-flip permutation test (20,000 draws,
p = (k+1)/(B+1), so never 0). In the cross-framework study the p-values are Holm-adjusted within
each family of 16 tests (8 frameworks x 2 contrasts). Per-control scores are committed
(results/*_per_control.csv.gz), so every paired number can be recomputed. Synthetic orgs use
t-intervals of the mean gap over 25 orgs. The ablation range shows the sensitivity to the rule
set: a random 10% of the rules is removed, 500 draws. A with-replacement bootstrap is not used
there, because coverage depends on distinct rules. Counts over the full catalog (for example
the CIS-function split) are exact, not estimates.
Threats to validity. A Sigma tag is not proof of detection quality. Mappings were authored against older ATT&CK releases and are carried forward through revoked-by links. CIS and CTID built their mappings through ATT&CK mitigations, which favours the mitigation bridge. All postures are synthetic.
0. Ablation: what each evidence requirement removes
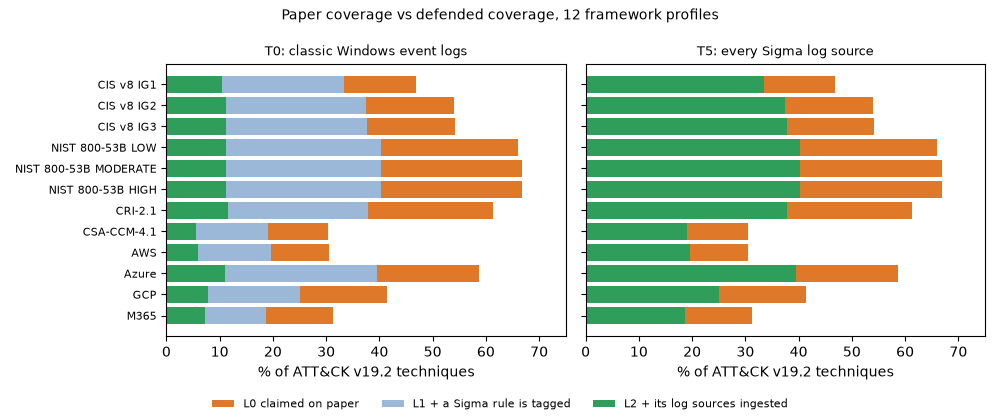
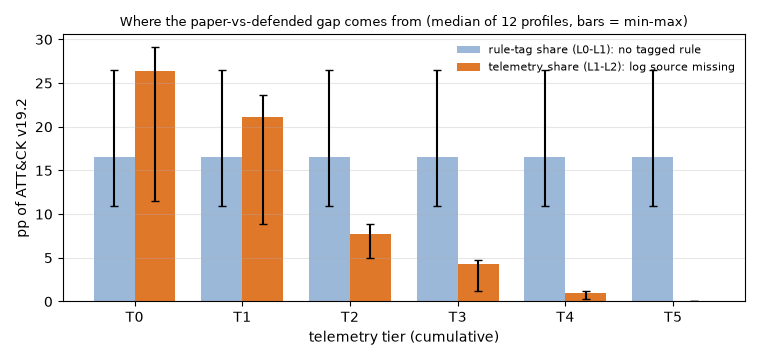
Percent of the 697 ATT&CK v19.2 techniques; 2614 stable+test SigmaHQ rules deployed. Brackets: one-sided sensitivity range (2.5-97.5 percentile) when a random 10% of those rules is removed, 500 draws; removing rules can only lower coverage, so the range sits at or below the point estimate. It is not a confidence interval. Telemetry tiers as in section A of the coverage results.
Across 12 framework profiles the paper-vs-defended overstatement is 24.1-55.7 pp with classic Windows logs only (T0) and still 10.9-26.5 pp with every Sigma log source (T5).
Where the gap comes from: the telemetry share (L1-L2) is larger than the rule-tag share (L0-L1) in 11/12 at T0, 4/12 at T1, 0/12 at T2, 0/12 at T3, 0/12 at T4, 0/12 at T5 profiles. With classic Windows logs most of the gap is missing telemetry; once Sysmon-class endpoint logs are ingested (T2+), most of what remains is claimed techniques that no deployed SigmaHQ rule is tagged with.
T0 and T5 rows (the full table is below):
| tier | framework | L0 claimed | L1 + rule tag | L2 + telemetry (defended) | overstatement L0-L2 (pp) | rule-tag share L0-L1 (pp) | telemetry share L1-L2 (pp) |
|---|---|---|---|---|---|---|---|
| T0 | CIS v8 IG1 | 46.9 | 33.4 [31.9, 33.1] | 10.5 [9.5, 10.5] | 36.4 | 13.5 | 23.0 |
| T0 | CIS v8 IG2 | 53.9 | 37.4 [35.7, 37.2] | 11.2 [10.0, 11.2] | 42.8 | 16.5 | 26.3 |
| T0 | CIS v8 IG3 | 54.2 | 37.7 [36.0, 37.4] | 11.2 [10.0, 11.2] | 43.0 | 16.5 | 26.5 |
| T0 | NIST 800-53B LOW | 66.0 | 40.3 [38.6, 39.9] | 11.2 [10.0, 11.2] | 54.8 | 25.7 | 29.1 |
| T0 | NIST 800-53B MODERATE | 66.9 | 40.3 [38.6, 39.9] | 11.2 [10.0, 11.2] | 55.7 | 26.5 | 29.1 |
| T0 | NIST 800-53B HIGH | 66.9 | 40.3 [38.6, 39.9] | 11.2 [10.0, 11.2] | 55.7 | 26.5 | 29.1 |
| T0 | CRI-2.1 | 61.3 | 37.9 [36.2, 37.6] | 11.5 [10.2, 11.3] | 49.8 | 23.4 | 26.4 |
| T0 | CSA-CCM-4.1 | 30.4 | 19.1 [18.1, 19.1] | 5.6 [4.9, 5.6] | 24.8 | 11.3 | 13.5 |
| T0 | AWS | 30.6 | 19.7 [18.7, 19.7] | 5.9 [5.0, 5.9] | 24.7 | 10.9 | 13.8 |
| T0 | Azure | 58.7 | 39.5 [37.6, 39.2] | 11.0 [9.8, 10.9] | 47.6 | 19.2 | 28.4 |
| T0 | GCP | 41.5 | 25.1 [24.1, 25.1] | 7.7 [6.9, 7.7] | 33.7 | 16.4 | 17.4 |
| T0 | M365 | 31.3 | 18.7 [17.8, 18.7] | 7.2 [6.3, 7.2] | 24.1 | 12.6 | 11.5 |
| T5 | CIS v8 IG1 | 46.9 | 33.4 [31.9, 33.1] | 33.4 [31.9, 33.1] | 13.5 | 13.5 | 0.0 |
| T5 | CIS v8 IG2 | 53.9 | 37.4 [35.7, 37.2] | 37.4 [35.7, 37.2] | 16.5 | 16.5 | 0.0 |
| T5 | CIS v8 IG3 | 54.2 | 37.7 [36.0, 37.4] | 37.7 [36.0, 37.4] | 16.5 | 16.5 | 0.0 |
| T5 | NIST 800-53B LOW | 66.0 | 40.3 [38.6, 39.9] | 40.3 [38.6, 39.9] | 25.7 | 25.7 | 0.0 |
| T5 | NIST 800-53B MODERATE | 66.9 | 40.3 [38.6, 39.9] | 40.3 [38.6, 39.9] | 26.5 | 26.5 | 0.0 |
| T5 | NIST 800-53B HIGH | 66.9 | 40.3 [38.6, 39.9] | 40.3 [38.6, 39.9] | 26.5 | 26.5 | 0.0 |
| T5 | CRI-2.1 | 61.3 | 37.9 [36.2, 37.6] | 37.9 [36.2, 37.6] | 23.4 | 23.4 | 0.0 |
| T5 | CSA-CCM-4.1 | 30.4 | 19.1 [18.1, 19.1] | 19.1 [18.1, 19.1] | 11.3 | 11.3 | 0.0 |
| T5 | AWS | 30.6 | 19.7 [18.7, 19.7] | 19.7 [18.7, 19.7] | 10.9 | 10.9 | 0.0 |
| T5 | Azure | 58.7 | 39.5 [37.6, 39.2] | 39.5 [37.6, 39.2] | 19.2 | 19.2 | 0.0 |
| T5 | GCP | 41.5 | 25.1 [24.1, 25.1] | 25.1 [24.1, 25.1] | 16.4 | 16.4 | 0.0 |
| T5 | M365 | 31.3 | 18.7 [17.8, 18.7] | 18.7 [17.8, 18.7] | 12.6 | 12.6 | 0.0 |
What the control layer adds over a detection-only view (CIS v8 IG2)
Detectable = a live rule exists, whatever is claimed (what a DeTT&CT-style data-source and detection view reports). Paper-only techniques are split by the CIS Security Function of the safeguards that claim them; those claimed only by Protect/Identify/Respond/Recover safeguards may be prevented rather than detected, so they are coverage without detection evidence, not proof of exposure.
| tier | detectable, no control layer (DeTT&CT-style) % | defended (CIS IG2 claimed AND detectable) % | detectable but not claimed | paper-only | paper-only, claimed by a Detect safeguard | paper-only, claimed only by non-Detect safeguards |
|---|---|---|---|---|---|---|
| T0 | 13.2 | 11.2 | 14 | 298 | 68 | 230 |
| T1 | 22.0 | 16.5 | 38 | 261 | 58 | 203 |
| T2 | 41.3 | 29.4 | 83 | 171 | 36 | 135 |
| T3 | 46.1 | 32.7 | 93 | 148 | 33 | 115 |
| T4 | 50.6 | 36.4 | 99 | 122 | 27 | 95 |
| T5 | 52.1 | 37.4 | 102 | 115 | 27 | 88 |
Full ablation table: 12 profiles x 6 telemetry tiers (72 rows)
| tier | framework | L0 claimed | L1 + rule tag | L2 + telemetry (defended) | overstatement L0-L2 (pp) | rule-tag share L0-L1 (pp) | telemetry share L1-L2 (pp) |
|---|---|---|---|---|---|---|---|
| T0 | CIS v8 IG1 | 46.9 | 33.4 [31.9, 33.1] | 10.5 [9.5, 10.5] | 36.4 | 13.5 | 23.0 |
| T0 | CIS v8 IG2 | 53.9 | 37.4 [35.7, 37.2] | 11.2 [10.0, 11.2] | 42.8 | 16.5 | 26.3 |
| T0 | CIS v8 IG3 | 54.2 | 37.7 [36.0, 37.4] | 11.2 [10.0, 11.2] | 43.0 | 16.5 | 26.5 |
| T0 | NIST 800-53B LOW | 66.0 | 40.3 [38.6, 39.9] | 11.2 [10.0, 11.2] | 54.8 | 25.7 | 29.1 |
| T0 | NIST 800-53B MODERATE | 66.9 | 40.3 [38.6, 39.9] | 11.2 [10.0, 11.2] | 55.7 | 26.5 | 29.1 |
| T0 | NIST 800-53B HIGH | 66.9 | 40.3 [38.6, 39.9] | 11.2 [10.0, 11.2] | 55.7 | 26.5 | 29.1 |
| T0 | CRI-2.1 | 61.3 | 37.9 [36.2, 37.6] | 11.5 [10.2, 11.3] | 49.8 | 23.4 | 26.4 |
| T0 | CSA-CCM-4.1 | 30.4 | 19.1 [18.1, 19.1] | 5.6 [4.9, 5.6] | 24.8 | 11.3 | 13.5 |
| T0 | AWS | 30.6 | 19.7 [18.7, 19.7] | 5.9 [5.0, 5.9] | 24.7 | 10.9 | 13.8 |
| T0 | Azure | 58.7 | 39.5 [37.6, 39.2] | 11.0 [9.8, 10.9] | 47.6 | 19.2 | 28.4 |
| T0 | GCP | 41.5 | 25.1 [24.1, 25.1] | 7.7 [6.9, 7.7] | 33.7 | 16.4 | 17.4 |
| T0 | M365 | 31.3 | 18.7 [17.8, 18.7] | 7.2 [6.3, 7.2] | 24.1 | 12.6 | 11.5 |
| T1 | CIS v8 IG1 | 46.9 | 33.4 [31.9, 33.1] | 14.9 [13.6, 14.8] | 32.0 | 13.5 | 18.5 |
| T1 | CIS v8 IG2 | 53.9 | 37.4 [35.7, 37.2] | 16.5 [14.9, 16.4] | 37.4 | 16.5 | 20.9 |
| T1 | CIS v8 IG3 | 54.2 | 37.7 [36.0, 37.4] | 16.5 [14.9, 16.4] | 37.7 | 16.5 | 21.2 |
| T1 | NIST 800-53B LOW | 66.0 | 40.3 [38.6, 39.9] | 16.6 [15.1, 16.4] | 49.4 | 25.7 | 23.7 |
| T1 | NIST 800-53B MODERATE | 66.9 | 40.3 [38.6, 39.9] | 16.6 [15.1, 16.4] | 50.2 | 26.5 | 23.7 |
| T1 | NIST 800-53B HIGH | 66.9 | 40.3 [38.6, 39.9] | 16.6 [15.1, 16.4] | 50.2 | 26.5 | 23.7 |
| T1 | CRI-2.1 | 61.3 | 37.9 [36.2, 37.6] | 16.4 [14.8, 16.1] | 44.9 | 23.4 | 21.5 |
| T1 | CSA-CCM-4.1 | 30.4 | 19.1 [18.1, 19.1] | 8.6 [7.6, 8.6] | 21.8 | 11.3 | 10.5 |
| T1 | AWS | 30.6 | 19.7 [18.7, 19.7] | 9.5 [8.3, 9.5] | 21.1 | 10.9 | 10.2 |
| T1 | Azure | 58.7 | 39.5 [37.6, 39.2] | 17.9 [16.2, 17.6] | 40.7 | 19.2 | 21.5 |
| T1 | GCP | 41.5 | 25.1 [24.1, 25.1] | 11.5 [10.2, 11.5] | 30.0 | 16.4 | 13.6 |
| T1 | M365 | 31.3 | 18.7 [17.8, 18.7] | 9.8 [8.9, 9.8] | 21.5 | 12.6 | 8.9 |
| T2 | CIS v8 IG1 | 46.9 | 33.4 [31.9, 33.1] | 26.1 [24.8, 26.0] | 20.8 | 13.5 | 7.3 |
| T2 | CIS v8 IG2 | 53.9 | 37.4 [35.7, 37.2] | 29.4 [28.0, 29.3] | 24.5 | 16.5 | 8.0 |
| T2 | CIS v8 IG3 | 54.2 | 37.7 [36.0, 37.4] | 29.7 [28.3, 29.6] | 24.5 | 16.5 | 8.0 |
| T2 | NIST 800-53B LOW | 66.0 | 40.3 [38.6, 39.9] | 31.4 [30.0, 31.1] | 34.6 | 25.7 | 8.9 |
| T2 | NIST 800-53B MODERATE | 66.9 | 40.3 [38.6, 39.9] | 31.4 [30.0, 31.1] | 35.4 | 26.5 | 8.9 |
| T2 | NIST 800-53B HIGH | 66.9 | 40.3 [38.6, 39.9] | 31.4 [30.0, 31.1] | 35.4 | 26.5 | 8.9 |
| T2 | CRI-2.1 | 61.3 | 37.9 [36.2, 37.6] | 29.3 [27.8, 29.1] | 32.0 | 23.4 | 8.6 |
| T2 | CSA-CCM-4.1 | 30.4 | 19.1 [18.1, 19.1] | 13.6 [12.9, 13.6] | 16.8 | 11.3 | 5.5 |
| T2 | AWS | 30.6 | 19.7 [18.7, 19.7] | 14.1 [13.2, 14.1] | 16.5 | 10.9 | 5.6 |
| T2 | Azure | 58.7 | 39.5 [37.6, 39.2] | 32.0 [30.3, 31.7] | 26.7 | 19.2 | 7.5 |
| T2 | GCP | 41.5 | 25.1 [24.1, 25.1] | 19.2 [18.4, 19.2] | 22.2 | 16.4 | 5.9 |
| T2 | M365 | 31.3 | 18.7 [17.8, 18.7] | 13.6 [13.1, 13.6] | 17.6 | 12.6 | 5.0 |
| T3 | CIS v8 IG1 | 46.9 | 33.4 [31.9, 33.1] | 29.1 [27.7, 28.8] | 17.8 | 13.5 | 4.3 |
| T3 | CIS v8 IG2 | 53.9 | 37.4 [35.7, 37.2] | 32.7 [31.1, 32.4] | 21.2 | 16.5 | 4.7 |
| T3 | CIS v8 IG3 | 54.2 | 37.7 [36.0, 37.4] | 33.0 [31.3, 32.7] | 21.2 | 16.5 | 4.7 |
| T3 | NIST 800-53B LOW | 66.0 | 40.3 [38.6, 39.9] | 35.6 [33.7, 35.3] | 30.4 | 25.7 | 4.7 |
| T3 | NIST 800-53B MODERATE | 66.9 | 40.3 [38.6, 39.9] | 35.6 [33.7, 35.3] | 31.3 | 26.5 | 4.7 |
| T3 | NIST 800-53B HIGH | 66.9 | 40.3 [38.6, 39.9] | 35.6 [33.7, 35.3] | 31.3 | 26.5 | 4.7 |
| T3 | CRI-2.1 | 61.3 | 37.9 [36.2, 37.6] | 33.6 [32.0, 33.3] | 27.7 | 23.4 | 4.3 |
| T3 | CSA-CCM-4.1 | 30.4 | 19.1 [18.1, 19.1] | 17.5 [16.5, 17.4] | 12.9 | 11.3 | 1.6 |
| T3 | AWS | 30.6 | 19.7 [18.7, 19.7] | 17.1 [16.1, 17.1] | 13.5 | 10.9 | 2.6 |
| T3 | Azure | 58.7 | 39.5 [37.6, 39.2] | 35.9 [33.9, 35.4] | 22.8 | 19.2 | 3.6 |
| T3 | GCP | 41.5 | 25.1 [24.1, 25.1] | 23.0 [21.8, 22.8] | 18.5 | 16.4 | 2.2 |
| T3 | M365 | 31.3 | 18.7 [17.8, 18.7] | 17.5 [16.6, 17.5] | 13.8 | 12.6 | 1.1 |
| T4 | CIS v8 IG1 | 46.9 | 33.4 [31.9, 33.1] | 32.6 [31.0, 32.3] | 14.3 | 13.5 | 0.9 |
| T4 | CIS v8 IG2 | 53.9 | 37.4 [35.7, 37.2] | 36.4 [34.7, 36.2] | 17.5 | 16.5 | 1.0 |
| T4 | CIS v8 IG3 | 54.2 | 37.7 [36.0, 37.4] | 36.7 [35.0, 36.4] | 17.5 | 16.5 | 1.0 |
| T4 | NIST 800-53B LOW | 66.0 | 40.3 [38.6, 39.9] | 39.2 [37.3, 38.7] | 26.8 | 25.7 | 1.1 |
| T4 | NIST 800-53B MODERATE | 66.9 | 40.3 [38.6, 39.9] | 39.2 [37.3, 38.7] | 27.7 | 26.5 | 1.1 |
| T4 | NIST 800-53B HIGH | 66.9 | 40.3 [38.6, 39.9] | 39.2 [37.3, 38.7] | 27.7 | 26.5 | 1.1 |
| T4 | CRI-2.1 | 61.3 | 37.9 [36.2, 37.6] | 36.7 [35.0, 36.4] | 24.5 | 23.4 | 1.1 |
| T4 | CSA-CCM-4.1 | 30.4 | 19.1 [18.1, 19.1] | 18.1 [17.1, 18.1] | 12.3 | 11.3 | 1.0 |
| T4 | AWS | 30.6 | 19.7 [18.7, 19.7] | 18.8 [17.8, 18.8] | 11.8 | 10.9 | 0.9 |
| T4 | Azure | 58.7 | 39.5 [37.6, 39.2] | 38.5 [36.6, 38.2] | 20.2 | 19.2 | 1.0 |
| T4 | GCP | 41.5 | 25.1 [24.1, 25.1] | 24.4 [23.4, 24.4] | 17.1 | 16.4 | 0.7 |
| T4 | M365 | 31.3 | 18.7 [17.8, 18.7] | 18.4 [17.5, 18.4] | 12.9 | 12.6 | 0.3 |
| T5 | CIS v8 IG1 | 46.9 | 33.4 [31.9, 33.1] | 33.4 [31.9, 33.1] | 13.5 | 13.5 | 0.0 |
| T5 | CIS v8 IG2 | 53.9 | 37.4 [35.7, 37.2] | 37.4 [35.7, 37.2] | 16.5 | 16.5 | 0.0 |
| T5 | CIS v8 IG3 | 54.2 | 37.7 [36.0, 37.4] | 37.7 [36.0, 37.4] | 16.5 | 16.5 | 0.0 |
| T5 | NIST 800-53B LOW | 66.0 | 40.3 [38.6, 39.9] | 40.3 [38.6, 39.9] | 25.7 | 25.7 | 0.0 |
| T5 | NIST 800-53B MODERATE | 66.9 | 40.3 [38.6, 39.9] | 40.3 [38.6, 39.9] | 26.5 | 26.5 | 0.0 |
| T5 | NIST 800-53B HIGH | 66.9 | 40.3 [38.6, 39.9] | 40.3 [38.6, 39.9] | 26.5 | 26.5 | 0.0 |
| T5 | CRI-2.1 | 61.3 | 37.9 [36.2, 37.6] | 37.9 [36.2, 37.6] | 23.4 | 23.4 | 0.0 |
| T5 | CSA-CCM-4.1 | 30.4 | 19.1 [18.1, 19.1] | 19.1 [18.1, 19.1] | 11.3 | 11.3 | 0.0 |
| T5 | AWS | 30.6 | 19.7 [18.7, 19.7] | 19.7 [18.7, 19.7] | 10.9 | 10.9 | 0.0 |
| T5 | Azure | 58.7 | 39.5 [37.6, 39.2] | 39.5 [37.6, 39.2] | 19.2 | 19.2 | 0.0 |
| T5 | GCP | 41.5 | 25.1 [24.1, 25.1] | 25.1 [24.1, 25.1] | 16.4 | 16.4 | 0.0 |
| T5 | M365 | 31.3 | 18.7 [17.8, 18.7] | 18.7 [17.8, 18.7] | 12.6 | 12.6 | 0.0 |
Wall time: 48 s.
Source: GitHub Actions realdata run 37092934843 at commit 6ff466dd6215 (Linux-6.17.0-1022-azure-x86_64-with-glibc2.39, Python 3.12.14).
1. Paper vs real coverage
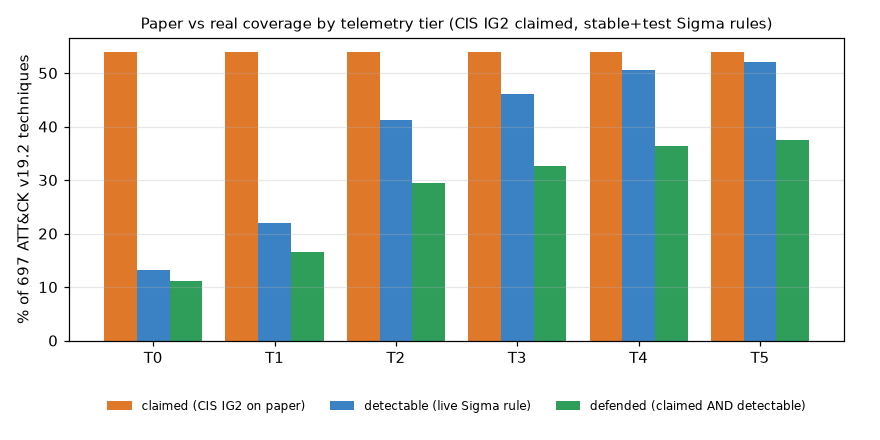
A. Telemetry tier x claimed CIS Implementation Group
| tier | claims | log_sources | claimed_pct | detectable_pct | true_pct | weighted_true_pct | gap_pp | paper_only | dead_rules |
|---|---|---|---|---|---|---|---|---|---|
| T0 classic Windows event logs | IG1 | 3 | 46.9 | 13.2 | 10.5 | 8.7 | 36.4 | 254 | 2416 |
| T0 classic Windows event logs | IG2 | 3 | 53.9 | 13.2 | 11.2 | 9.2 | 42.8 | 298 | 2416 |
| T0 classic Windows event logs | IG3 | 3 | 54.2 | 13.2 | 11.2 | 9.2 | 43.0 | 300 | 2416 |
| T1 + PowerShell logging | IG1 | 8 | 46.9 | 22.0 | 14.9 | 12.5 | 32.0 | 223 | 2250 |
| T1 + PowerShell logging | IG2 | 8 | 53.9 | 22.0 | 16.5 | 13.6 | 37.4 | 261 | 2250 |
| T1 + PowerShell logging | IG3 | 8 | 54.2 | 22.0 | 16.5 | 13.6 | 37.7 | 263 | 2250 |
| T2 + Sysmon/EDR-class endpoint | IG1 | 31 | 46.9 | 41.3 | 26.1 | 23.7 | 20.8 | 145 | 623 |
| T2 + Sysmon/EDR-class endpoint | IG2 | 31 | 53.9 | 41.3 | 29.4 | 26.6 | 24.5 | 171 | 623 |
| T2 + Sysmon/EDR-class endpoint | IG3 | 31 | 54.2 | 41.3 | 29.7 | 26.9 | 24.5 | 171 | 623 |
| T3 + cloud & identity audit | IG1 | 46 | 46.9 | 46.1 | 29.1 | 26.1 | 17.8 | 124 | 446 |
| T3 + cloud & identity audit | IG2 | 46 | 53.9 | 46.1 | 32.7 | 29.2 | 21.2 | 148 | 446 |
| T3 + cloud & identity audit | IG3 | 46 | 54.2 | 46.1 | 33.0 | 29.5 | 21.2 | 148 | 446 |
| T4 + network, web, Linux, macOS | IG1 | 72 | 46.9 | 50.6 | 32.6 | 29.1 | 14.3 | 100 | 134 |
| T4 + network, web, Linux, macOS | IG2 | 72 | 53.9 | 50.6 | 36.4 | 32.6 | 17.5 | 122 | 134 |
| T4 + network, web, Linux, macOS | IG3 | 72 | 54.2 | 50.6 | 36.7 | 32.8 | 17.5 | 122 | 134 |
| T5 every Sigma log source | IG1 | 116 | 46.9 | 52.1 | 33.4 | 29.9 | 13.5 | 94 | 0 |
| T5 every Sigma log source | IG2 | 116 | 53.9 | 52.1 | 37.4 | 33.5 | 16.5 | 115 | 0 |
| T5 every Sigma log source | IG3 | 116 | 54.2 | 52.1 | 37.7 | 33.7 | 16.5 | 115 | 0 |
weighted_true_pct scores each defended technique by rule quality (ADR 0007) instead of 0/1.
B. Random synthetic orgs (25 per maturity level)
| maturity | orgs | claimed_pct | true_pct | gap_pp | gap_95ci |
|---|---|---|---|---|---|
| 0.2 | 25 | 50.5 +/- 1.8 | 17.2 +/- 5.0 | 33.3 +/- 5.2 | [31.2, 35.4] |
| 0.4 | 25 | 52.0 +/- 1.5 | 23.6 +/- 4.3 | 28.4 +/- 4.6 | [26.5, 30.3] |
| 0.6 | 25 | 52.9 +/- 1.3 | 29.5 +/- 3.1 | 23.4 +/- 3.3 | [22.0, 24.8] |
| 0.8 | 25 | 53.6 +/- 0.6 | 33.5 +/- 1.5 | 20.1 +/- 1.5 | [19.4, 20.7] |
Values are mean +/- sd over 25 orgs (seeds 0-24); gap_95ci is a t-interval of the mean gap.
C. Engine performance
| deployed_rules | ingested_log_sources | coverage_ms | spof_fast_s | spof_bruteforce_s | speedup | identical_results |
|---|---|---|---|---|---|---|
| 2877 | 46 | 2.9 | 0.002 | 7.66 | 4902.8 | True |
D. NIST SP 800-53 rev5 claims (CTID mapping, ATT&CK v16.1 carried to v19.2)
| tier | claimed_pct | detectable_pct | true_pct | weighted_true_pct | gap_pp | paper_only |
|---|---|---|---|---|---|---|
| T0 classic Windows event logs | 66.9 | 13.2 | 11.2 | 9.2 | 55.7 | 388 |
| T1 + PowerShell logging | 66.9 | 22.0 | 16.6 | 13.6 | 50.2 | 350 |
| T2 + Sysmon/EDR-class endpoint | 66.9 | 41.3 | 31.4 | 28.2 | 35.4 | 247 |
| T3 + cloud & identity audit | 66.9 | 46.1 | 35.6 | 31.6 | 31.3 | 218 |
| T4 + network, web, Linux, macOS | 66.9 | 50.6 | 39.2 | 34.8 | 27.7 | 193 |
| T5 every Sigma log source | 66.9 | 52.1 | 40.3 | 35.9 | 26.5 | 185 |
E. Structural ceilings (CIS v8 mapping, SigmaHQ)
| quantity | value |
|---|---|
| techniques_v19.2 | 697 |
| cis_mapped_v19.2 | 378 |
| cis_mapped_pct | 54.2 |
| not_claimable_by_cis | 319 |
| not_claimable_pp | 45.8 |
| added_after_v8.2 | 172 |
| added_after_v8.2_pp | 24.7 |
| v8.2_era_never_mapped | 147 |
| v8.2_era_never_mapped_pp | 21.1 |
| techniques_v8.2 | 530 |
| cis_mapped_v8.2 | 383 |
| cis_coverage_v8.2_pct | 72.3 |
| detectable_T5_stable_test | 363 |
| detectable_T5_stable_test_pct | 52.1 |
| detectable_T5_all_rules | 378 |
| detectable_T5_all_rules_pct | 54.2 |
| rules_all | 2877 |
The CIS mapping reaches 54.2% of ATT&CK v19.2. Of the 45.8 pp it cannot claim, 24.7 pp are 172 techniques added after v8.2 and 21.1 pp are 147 v8.2-era techniques CIS never mapped. On v8.2 itself CIS covers 72.3% (383 of 530). With every log source ingested, stable+test rules detect 52.1% and all 2877 rules 54.2%.
Source: GitHub Actions realdata run 37092934843 at commit 6ff466dd6215 (Linux-6.17.0-1022-azure-x86_64-with-glibc2.39, Python 3.12.14).
2. Auto-mapping controls to ATT&CK
Each mapper sees only the safeguard's title and description. Ground truth is the official CIS v8 -> ATT&CK v8.2 mapping (105 mapped safeguards).
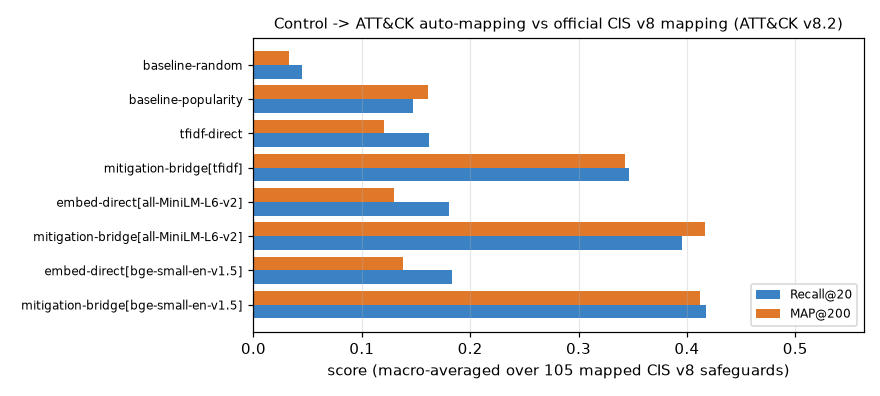
ATT&CK v8.2 (labels exactly as published)
Cells are the macro mean over mapped safeguards with a 95% percentile bootstrap interval (1,000 resamples of safeguards, seed 0).
| mapper | P@10 | R@20 | R@50 | MAP@200 | seconds |
|---|---|---|---|---|---|
| baseline-random | 0.062 [0.040, 0.086] | 0.045 [0.028, 0.069] | 0.096 [0.070, 0.126] | 0.033 [0.026, 0.041] | 0.05 |
| baseline-popularity | 0.206 [0.153, 0.260] | 0.147 [0.115, 0.183] | 0.330 [0.277, 0.381] | 0.161 [0.129, 0.196] | 0.05 |
| tfidf-direct | 0.162 [0.122, 0.203] | 0.162 [0.125, 0.204] | 0.271 [0.226, 0.316] | 0.120 [0.095, 0.148] | 0.26 |
| mitigation-bridge[tfidf] | 0.311 [0.244, 0.376] | 0.347 [0.283, 0.411] | 0.550 [0.479, 0.620] | 0.343 [0.281, 0.401] | 0.28 |
| embed-direct[all-MiniLM-L6-v2] | 0.166 [0.127, 0.208] | 0.180 [0.139, 0.228] | 0.293 [0.244, 0.350] | 0.130 [0.101, 0.161] | 1.21 |
| mitigation-bridge[all-MiniLM-L6-v2] | 0.384 [0.317, 0.457] | 0.395 [0.326, 0.465] | 0.621 [0.553, 0.696] | 0.417 [0.357, 0.478] | 2.26 |
| embed-direct[bge-small-en-v1.5] | 0.187 [0.143, 0.228] | 0.183 [0.141, 0.226] | 0.295 [0.241, 0.348] | 0.138 [0.107, 0.166] | 2.11 |
| mitigation-bridge[bge-small-en-v1.5] | 0.388 [0.323, 0.457] | 0.418 [0.352, 0.495] | 0.623 [0.551, 0.694] | 0.412 [0.353, 0.475] | 4.12 |
Random baseline over 10 seeds: P@10 0.055 +/- 0.007, R@20 0.04 +/- 0.006, MAP@200 0.031 +/- 0.003.
Oracle ceiling: a perfect ranker scores P@10 = 0.747, because 47 of 105 safeguards have fewer than 10 gold techniques.
Paired differences over the same safeguards (paired bootstrap, 2,000 resamples; two-sided sign-flip permutation test, 20,000 draws, p never 0; not multiplicity-adjusted):
| comparison (ATT&CK v8.2) | MAP@200 diff | 95% CI (paired bootstrap) | p (sign-flip) |
|---|---|---|---|
| mitigation-bridge[all-MiniLM-L6-v2] - mitigation-bridge[bge-small-en-v1.5] | +0.005 | [-0.044, +0.054] | 0.84 |
| mitigation-bridge[all-MiniLM-L6-v2] - baseline-popularity | +0.256 | [+0.192, +0.317] | 5.0e-05 |
| mitigation-bridge[tfidf] - baseline-popularity | +0.182 | [+0.120, +0.239] | 5.0e-05 |
| mitigation-bridge[all-MiniLM-L6-v2] - mitigation-bridge[tfidf] | +0.074 | [+0.020, +0.128] | 0.0081 |
| mitigation-bridge[all-MiniLM-L6-v2] - embed-direct[all-MiniLM-L6-v2] | +0.288 | [+0.230, +0.344] | 5.0e-05 |
| mitigation-bridge[tfidf] - tfidf-direct | +0.223 | [+0.169, +0.277] | 5.0e-05 |
| tfidf-direct - baseline-popularity | -0.041 | [-0.081, -0.004] | 0.039 |
ATT&CK v19.2 (labels carried forward via revoked-by)
| mapper | P@10 | R@20 | R@50 | MAP@200 | seconds |
|---|---|---|---|---|---|
| baseline-random | 0.052 [0.031, 0.076] | 0.033 [0.021, 0.048] | 0.089 [0.065, 0.117] | 0.020 [0.015, 0.025] | 0.05 |
| baseline-popularity | 0.206 [0.153, 0.260] | 0.148 [0.116, 0.185] | 0.339 [0.285, 0.391] | 0.162 [0.130, 0.198] | 0.06 |
| tfidf-direct | 0.125 [0.093, 0.155] | 0.147 [0.113, 0.185] | 0.258 [0.208, 0.307] | 0.085 [0.068, 0.104] | 0.37 |
| mitigation-bridge[tfidf] | 0.272 [0.217, 0.330] | 0.300 [0.245, 0.355] | 0.544 [0.477, 0.608] | 0.285 [0.237, 0.332] | 0.42 |
| embed-direct[all-MiniLM-L6-v2] | 0.129 [0.098, 0.160] | 0.181 [0.139, 0.230] | 0.304 [0.249, 0.364] | 0.094 [0.072, 0.120] | 1.22 |
| mitigation-bridge[all-MiniLM-L6-v2] | 0.325 [0.267, 0.386] | 0.347 [0.285, 0.413] | 0.527 [0.456, 0.600] | 0.309 [0.261, 0.362] | 2.35 |
| embed-direct[bge-small-en-v1.5] | 0.143 [0.105, 0.181] | 0.154 [0.114, 0.198] | 0.269 [0.215, 0.325] | 0.094 [0.074, 0.115] | 2.12 |
| mitigation-bridge[bge-small-en-v1.5] | 0.334 [0.277, 0.394] | 0.363 [0.303, 0.435] | 0.558 [0.489, 0.635] | 0.323 [0.276, 0.372] | 4.35 |
Per-safeguard scores for every mapper: results/automap_per_control.csv.gz.
Source: GitHub Actions realdata run 37092934843 at commit 6ff466dd6215 (Linux-6.17.0-1022-azure-x86_64-with-glibc2.39, Python 3.12.14).
3. Recommender vs exact optimum
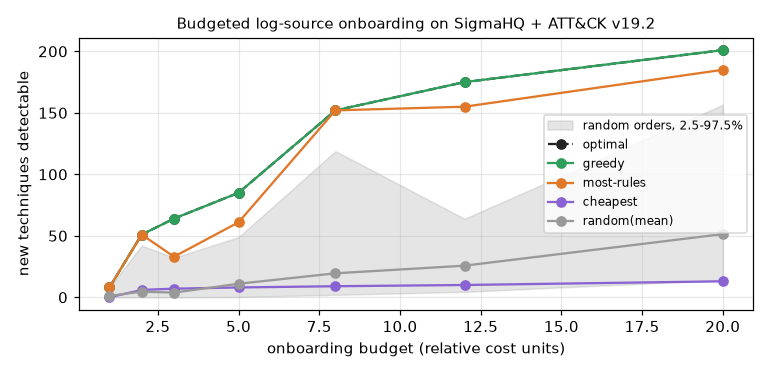
Techniques newly detectable vs onboarding budget (start: Acme real posture, 153 techniques already detectable, 99 candidate log sources)
| budget | greedy | optimal | greedy/optimal | most-rules | cheapest | random(mean) | random 2.5-97.5% | greedy/random(mean) | greedy_ms | ilp_ms |
|---|---|---|---|---|---|---|---|---|---|---|
| 1 | 8 | 8 | 1.0 | 8 | 0 | 1.1 | 0.0-8.0 | 7.5 | 74 | 8 |
| 2 | 51 | 51 | 1.0 | 51 | 6 | 4.6 | 0.0-42.0 | 11.2 | 77 | 10 |
| 3 | 64 | 64 | 1.0 | 33 | 7 | 3.8 | 0.0-32.2 | 17.0 | 113 | 29 |
| 5 | 85 | 85 | 1.0 | 61 | 8 | 11.0 | 0.2-48.8 | 7.7 | 151 | 36 |
| 8 | 152 | 152 | 1.0 | 152 | 9 | 19.5 | 2.0-118.9 | 7.8 | 131 | 8 |
| 12 | 175 | 175 | 1.0 | 155 | 10 | 25.7 | 4.5-63.8 | 6.8 | 246 | 6 |
| 20 | 201 | 201 | 1.0 | 185 | 13 | 51.4 | 14.0-156.5 | 3.9 | 531 | 9 |
Greedy finds 3.9-16.8x the mean of 50 random orders and 1.0-2.7x their 97.5th percentile; it beats most-rules-first by 0-31 techniques. Greedy equals the exact ILP at 7 of 7 budgets (an empirical result on this instance, not a guarantee).
Greedy plan (first 5 steps)
| step | onboard | cost | new_techniques | rules_unlocked |
|---|---|---|---|---|
| 1 | windows/ps_script | 1.15 | 51 | 134 |
| 2 | windows/process_creation | 6.7 | 101 | 1147 |
| 3 | cisco/aaa | 1.05 | 7 | 10 |
| 4 | linux/process_creation | 2.6 | 16 | 96 |
| 5 | bitbucket/audit | 1.0 | 4 | 12 |
Source: GitHub Actions realdata run 37092934843 at commit 6ff466dd6215 (Linux-6.17.0-1022-azure-x86_64-with-glibc2.39, Python 3.12.14).
4. Cross-framework comparison and transfer
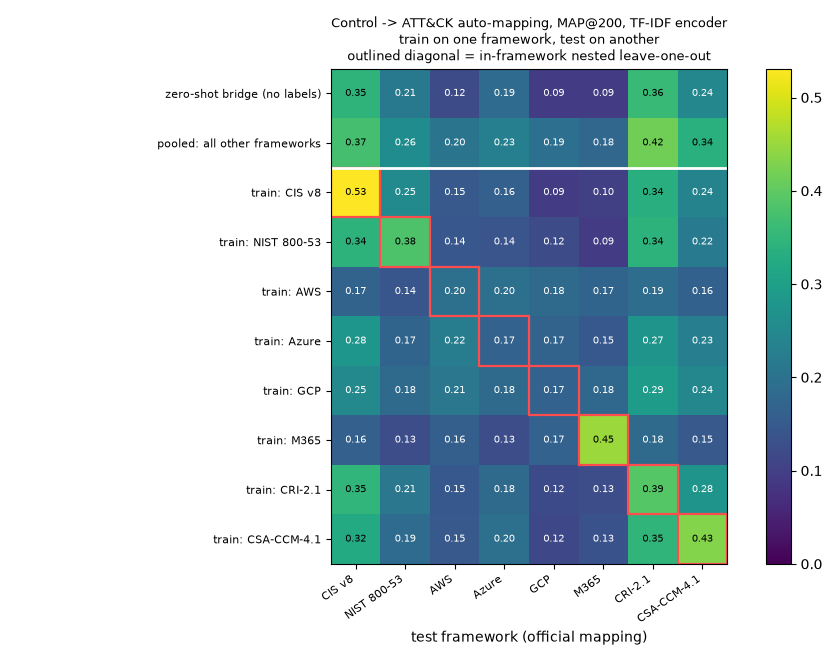
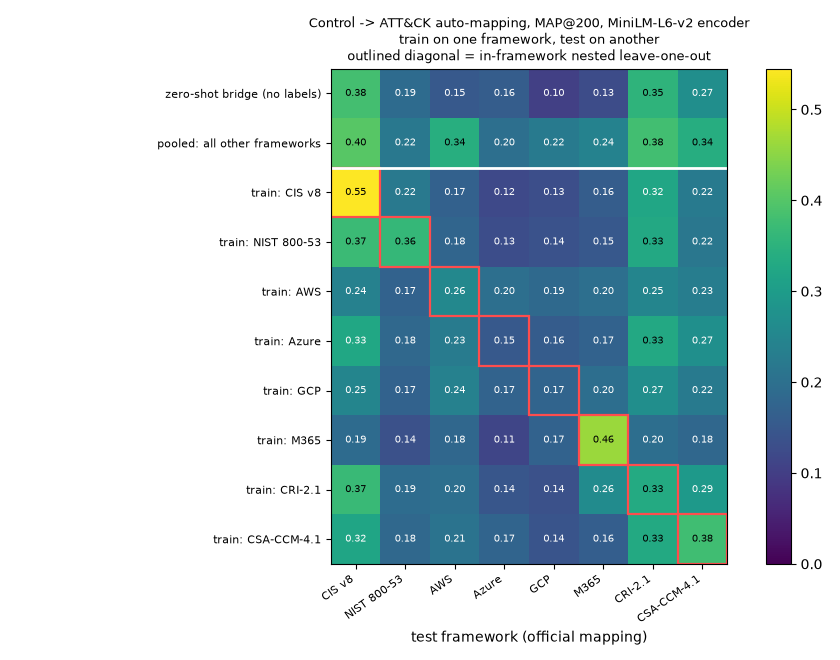
Frameworks side by side in ATT&CK v19.2, SP 800-53B baselines, and auto-mapping trained on one framework and tested on another (ADR 0009). Added in v1.1.0.
Frameworks in one ATT&CK release (v19.2)
| framework | source ATT&CK | controls (mapped) | pairs | pairs/control | techniques | % of ATT&CK v19.2 | carried fwd / dropped | candidate techniques |
|---|---|---|---|---|---|---|---|---|
| CIS v8 | 8.2 | 105 | 2919 | 27.8 | 378 | 54.2 | 134 / 14 | 525 |
| NIST 800-53 | 16.1 | 109 | 5236 | 48.0 | 466 | 66.9 | 173 / 1 | 653 |
| AWS | 16.1 | 20 | 467 | 23.4 | 213 | 30.6 | 21 / 0 | 653 |
| Azure | 16.1 | 38 | 938 | 24.7 | 409 | 58.7 | 26 / 0 | 653 |
| GCP | 16.1 | 40 | 507 | 12.7 | 289 | 41.5 | 16 / 0 | 653 |
| M365 | 16.1 | 38 | 684 | 18.0 | 218 | 31.3 | 27 / 0 | 653 |
| CRI-2.1 | 16.1 | 60 | 2146 | 35.8 | 427 | 61.3 | 45 / 0 | 653 |
| CSA-CCM-4.1 | 17.1 | 57 | 783 | 13.7 | 212 | 30.4 | 40 / 0 | 677 |
candidate techniques = v19.2 techniques that existed (directly or via revoked-by) in the ATT&CK release the framework was mapped against; auto-mappers are scored over that set only.
Union over all frameworks: 594 techniques; mapped by every framework: 48.
Technique-set overlap (Jaccard):
| CIS v8 | NIST 800-53 | AWS | Azure | GCP | M365 | CRI-2.1 | CSA-CCM-4.1 | |
|---|---|---|---|---|---|---|---|---|
| CIS v8 | 1.0 | 0.77 | 0.36 | 0.51 | 0.36 | 0.26 | 0.72 | 0.37 |
| NIST 800-53 | 0.77 | 1.0 | 0.35 | 0.61 | 0.47 | 0.35 | 0.84 | 0.39 |
| AWS | 0.36 | 0.35 | 1.0 | 0.4 | 0.39 | 0.26 | 0.36 | 0.44 |
| Azure | 0.51 | 0.61 | 0.4 | 1.0 | 0.5 | 0.35 | 0.59 | 0.37 |
| GCP | 0.36 | 0.47 | 0.39 | 0.5 | 1.0 | 0.42 | 0.45 | 0.4 |
| M365 | 0.26 | 0.35 | 0.26 | 0.35 | 0.42 | 1.0 | 0.36 | 0.38 |
| CRI-2.1 | 0.72 | 0.84 | 0.36 | 0.59 | 0.45 | 0.36 | 1.0 | 0.44 |
| CSA-CCM-4.1 | 0.37 | 0.39 | 0.44 | 0.37 | 0.4 | 0.38 | 0.44 | 1.0 |
NIST SP 800-53B baselines (CTID mapping, base controls only)
| baseline | controls in baseline (incl. enhancements) | of which base controls with a CTID mapping | techniques mitigated | % of ATT&CK v19.2 | median controls per technique |
|---|---|---|---|---|---|
| LOW | 149 | 51 | 460 | 66.0 | 7 |
| MODERATE | 287 | 79 | 466 | 66.9 | 10 |
| HIGH | 370 | 83 | 466 | 66.9 | 10 |
| PRIVACY | 96 | 7 | 237 | 34.0 | 1 |
MODERATE adds 6 techniques over LOW (T1090.004, T1535, T1550.004, T1595.003, T1657, T1666); HIGH adds 0 over MODERATE.
Auto-mapping transfer summary (TF-IDF encoder)
MAP@200 with 95% bootstrap intervals over the test framework's controls. The pooled source (every other framework's labels) is fixed in advance, so no test labels pick it. Nested LOO re-chooses the transfer weights without the held-out control. text: rich = CIS v8, NIST 800-53, CSA-CCM-4.1, CRI-2.1; sparse = the cloud security-stack mappings, which only give a product name.
| test framework | text | n | direct (no bridge) | zero-shot bridge | pooled transfer (all other fw) | in-framework nested LOO | single-source transfer mean (min-max) | sources below zero-shot |
|---|---|---|---|---|---|---|---|---|
| CIS v8 | rich | 105 | 0.115 | 0.346 [0.289, 0.399] | 0.374 [0.325, 0.428] | 0.531 [0.469, 0.592] | 0.268 (0.163-0.349) | 6/7 |
| NIST 800-53 | rich | 109 | 0.091 | 0.214 [0.173, 0.259] | 0.258 [0.215, 0.301] | 0.383 [0.323, 0.437] | 0.182 (0.126-0.252) | 6/7 |
| AWS | sparse | 20 | 0.052 | 0.124 [0.055, 0.215] | 0.204 [0.113, 0.312] | 0.195 [0.141, 0.249] | 0.169 (0.145-0.222) | 0/7 |
| Azure | sparse | 38 | 0.137 | 0.186 [0.124, 0.255] | 0.229 [0.175, 0.290] | 0.167 [0.122, 0.215] | 0.170 (0.126-0.197) | 5/7 |
| GCP | sparse | 40 | 0.044 | 0.092 [0.047, 0.150] | 0.194 [0.136, 0.261] | 0.167 [0.125, 0.218] | 0.139 (0.092-0.183) | 0/7 |
| M365 | sparse | 38 | 0.075 | 0.092 [0.060, 0.124] | 0.176 [0.122, 0.233] | 0.452 [0.372, 0.533] | 0.136 (0.094-0.177) | 0/7 |
| CRI-2.1 | rich | 60 | 0.121 | 0.359 [0.284, 0.437] | 0.416 [0.348, 0.485] | 0.390 [0.314, 0.469] | 0.281 (0.183-0.348) | 7/7 |
| CSA-CCM-4.1 | rich | 57 | 0.115 | 0.245 [0.180, 0.309] | 0.338 [0.274, 0.402] | 0.432 [0.354, 0.519] | 0.216 (0.149-0.275) | 5/7 |
Paired differences (TF-IDF encoder)
Mean difference in AP@200 over the same controls, paired bootstrap 95% interval (2,000 resamples), and a two-sided sign-flip permutation p-value (20,000 draws, never 0), Holm-adjusted within its family of 16 tests (8 frameworks x 2 contrasts): bridge - direct and pooled - zero-shot are the pre-specified family; the two nested-LOO contrasts are a second, exploratory family. * = Holm p < 0.05.
| test framework | bridge - direct | pooled - zero-shot | nested LOO - zero-shot | nested LOO - pooled |
|---|---|---|---|---|
| CIS v8 | +0.231 [+0.181, +0.280], Holm p 8.0e-04 * | +0.028 [-0.013, +0.068], Holm p 0.61 | +0.185 [+0.124, +0.246], Holm p 8.0e-04 * | +0.157 [+0.101, +0.215], Holm p 8.0e-04 * |
| NIST 800-53 | +0.124 [+0.087, +0.166], Holm p 8.0e-04 * | +0.044 [+0.010, +0.075], Holm p 0.081 | +0.168 [+0.106, +0.226], Holm p 8.0e-04 * | +0.125 [+0.070, +0.178], Holm p 1.0e-03 * |
| AWS | +0.072 [+0.009, +0.153], Holm p 0.22 | +0.080 [+0.037, +0.128], Holm p 0.026 * | +0.070 [-0.019, +0.144], Holm p 0.74 | -0.010 [-0.123, +0.086], Holm p 1 |
| Azure | +0.049 [-0.012, +0.114], Holm p 0.61 | +0.043 [-0.020, +0.103], Holm p 0.61 | -0.019 [-0.079, +0.036], Holm p 1 | -0.062 [-0.114, -0.015], Holm p 0.13 |
| GCP | +0.048 [+0.018, +0.091], Holm p 0.0093 * | +0.102 [+0.043, +0.160], Holm p 0.011 * | +0.075 [+0.018, +0.132], Holm p 0.13 | -0.027 [-0.082, +0.026], Holm p 1 |
| M365 | +0.017 [-0.026, +0.056], Holm p 0.61 | +0.084 [+0.046, +0.124], Holm p 0.0013 * | +0.360 [+0.284, +0.440], Holm p 8.0e-04 * | +0.276 [+0.192, +0.368], Holm p 8.0e-04 * |
| CRI-2.1 | +0.238 [+0.155, +0.322], Holm p 8.0e-04 * | +0.056 [+0.006, +0.104], Holm p 0.17 | +0.031 [-0.023, +0.083], Holm p 1 | -0.026 [-0.078, +0.029], Holm p 1 |
| CSA-CCM-4.1 | +0.129 [+0.056, +0.202], Holm p 0.01 * | +0.093 [+0.047, +0.139], Holm p 0.003 * | +0.187 [+0.110, +0.266], Holm p 8.0e-04 * | +0.094 [+0.023, +0.168], Holm p 0.13 |
- bridge - direct: interval above 0 on 6 of 8 (CIS v8, NIST 800-53, AWS, GCP, CRI-2.1, CSA-CCM-4.1), below 0 on 0; Holm p < 0.05 (m = 16): 5 of 8 positive (CIS v8, NIST 800-53, GCP, CRI-2.1, CSA-CCM-4.1), 0 negative (-).
- pooled - zero-shot: interval above 0 on 6 of 8 (NIST 800-53, AWS, GCP, M365, CRI-2.1, CSA-CCM-4.1), below 0 on 0; Holm p < 0.05 (m = 16): 4 of 8 positive (AWS, GCP, M365, CSA-CCM-4.1), 0 negative (-).
- nested LOO - zero-shot: interval above 0 on 5 of 8 (CIS v8, NIST 800-53, GCP, M365, CSA-CCM-4.1), below 0 on 0; Holm p < 0.05 (m = 16): 4 of 8 positive (CIS v8, NIST 800-53, M365, CSA-CCM-4.1), 0 negative (-).
- nested LOO - pooled: interval above 0 on 4 of 8 (CIS v8, NIST 800-53, M365, CSA-CCM-4.1), below 0 on 1; Holm p < 0.05 (m = 16): 3 of 8 positive (CIS v8, NIST 800-53, M365), 0 negative (-).
Single-source transfer matrix, MAP@200 (TF-IDF); first row = zero-shot bridge
Diagonal = leave-one-out with weights tuned on the same folds (optimistic; the nested LOO column above is the honest in-framework estimate, and the figure shows nested LOO on the diagonal).
| train / test | CIS v8 | NIST 800-53 | AWS | Azure | GCP | M365 | CRI-2.1 | CSA-CCM-4.1 |
|---|---|---|---|---|---|---|---|---|
| zero-shot | 0.346 | 0.214 | 0.124 | 0.186 | 0.092 | 0.092 | 0.359 | 0.245 |
| CIS v8 | 0.531 | 0.252 | 0.148 | 0.163 | 0.092 | 0.101 | 0.335 | 0.237 |
| NIST 800-53 | 0.344 | 0.383 | 0.145 | 0.141 | 0.124 | 0.094 | 0.343 | 0.216 |
| AWS | 0.170 | 0.142 | 0.231 | 0.197 | 0.183 | 0.172 | 0.189 | 0.164 |
| Azure | 0.279 | 0.172 | 0.222 | 0.200 | 0.170 | 0.146 | 0.274 | 0.227 |
| GCP | 0.250 | 0.184 | 0.211 | 0.183 | 0.182 | 0.177 | 0.293 | 0.245 |
| M365 | 0.163 | 0.126 | 0.160 | 0.126 | 0.167 | 0.457 | 0.183 | 0.149 |
| CRI-2.1 | 0.349 | 0.210 | 0.147 | 0.183 | 0.120 | 0.126 | 0.390 | 0.275 |
| CSA-CCM-4.1 | 0.324 | 0.186 | 0.149 | 0.196 | 0.115 | 0.134 | 0.348 | 0.432 |
Labels-only prior (train framework's technique frequencies), MAP@200 (TF-IDF):
| train / test | CIS v8 | NIST 800-53 | AWS | Azure | GCP | M365 | CRI-2.1 | CSA-CCM-4.1 |
|---|---|---|---|---|---|---|---|---|
| CIS v8 | 0.162 | 0.155 | 0.066 | 0.068 | 0.059 | 0.046 | 0.129 | 0.079 |
| NIST 800-53 | 0.142 | 0.161 | 0.125 | 0.086 | 0.103 | 0.062 | 0.135 | 0.108 |
| AWS | 0.073 | 0.104 | 0.231 | 0.169 | 0.149 | 0.164 | 0.096 | 0.086 |
| Azure | 0.087 | 0.100 | 0.190 | 0.150 | 0.121 | 0.118 | 0.097 | 0.082 |
| GCP | 0.074 | 0.099 | 0.198 | 0.144 | 0.153 | 0.153 | 0.090 | 0.101 |
| M365 | 0.063 | 0.077 | 0.137 | 0.092 | 0.132 | 0.350 | 0.092 | 0.074 |
| CRI-2.1 | 0.126 | 0.130 | 0.091 | 0.086 | 0.084 | 0.085 | 0.136 | 0.111 |
| CSA-CCM-4.1 | 0.089 | 0.100 | 0.127 | 0.091 | 0.113 | 0.119 | 0.119 | 0.169 |
Fitted weights (beta = kNN label transfer, gamma = prior): CIS v8: 0.25/0.0; NIST 800-53: 0.25/0.0; AWS: 0.0/0.5; Azure: 0.25/0.1; GCP: 0.0/0.25; M365: 1.0/0.5; CRI-2.1: 0.25/0.0; CSA-CCM-4.1: 0.25/0.0; pooled -> CIS v8: 0.25/0.0; pooled -> NIST 800-53: 0.25/0.0; pooled -> AWS: 0.25/0.0; pooled -> Azure: 0.25/0.0; pooled -> GCP: 0.25/0.0; pooled -> M365: 0.25/0.0; pooled -> CRI-2.1: 0.25/0.0; pooled -> CSA-CCM-4.1: 0.25/0.0
Auto-mapping transfer summary (MiniLM-L6-v2 encoder)
MAP@200 with 95% bootstrap intervals over the test framework's controls. The pooled source (every other framework's labels) is fixed in advance, so no test labels pick it. Nested LOO re-chooses the transfer weights without the held-out control. text: rich = CIS v8, NIST 800-53, CSA-CCM-4.1, CRI-2.1; sparse = the cloud security-stack mappings, which only give a product name.
| test framework | text | n | direct (no bridge) | zero-shot bridge | pooled transfer (all other fw) | in-framework nested LOO | single-source transfer mean (min-max) | sources below zero-shot |
|---|---|---|---|---|---|---|---|---|
| CIS v8 | rich | 105 | 0.125 | 0.383 [0.329, 0.440] | 0.403 [0.348, 0.465] | 0.545 [0.483, 0.605] | 0.295 (0.191-0.371) | 7/7 |
| NIST 800-53 | rich | 109 | 0.105 | 0.191 [0.148, 0.238] | 0.219 [0.174, 0.262] | 0.363 [0.305, 0.421] | 0.180 (0.136-0.220) | 5/7 |
| AWS | sparse | 20 | 0.081 | 0.153 [0.104, 0.212] | 0.342 [0.232, 0.479] | 0.255 [0.184, 0.337] | 0.200 (0.170-0.239) | 0/7 |
| Azure | sparse | 38 | 0.098 | 0.160 [0.101, 0.226] | 0.200 [0.146, 0.262] | 0.152 [0.107, 0.205] | 0.151 (0.114-0.200) | 4/7 |
| GCP | sparse | 40 | 0.078 | 0.104 [0.057, 0.162] | 0.223 [0.158, 0.297] | 0.175 [0.128, 0.226] | 0.151 (0.130-0.186) | 0/7 |
| M365 | sparse | 38 | 0.115 | 0.126 [0.087, 0.168] | 0.242 [0.168, 0.315] | 0.464 [0.385, 0.543] | 0.186 (0.150-0.263) | 0/7 |
| CRI-2.1 | rich | 60 | 0.136 | 0.354 [0.275, 0.431] | 0.380 [0.319, 0.444] | 0.333 [0.262, 0.412] | 0.289 (0.197-0.330) | 7/7 |
| CSA-CCM-4.1 | rich | 57 | 0.154 | 0.269 [0.206, 0.327] | 0.340 [0.278, 0.398] | 0.378 [0.307, 0.450] | 0.234 (0.181-0.294) | 5/7 |
Paired differences (MiniLM-L6-v2 encoder)
Mean difference in AP@200 over the same controls, paired bootstrap 95% interval (2,000 resamples), and a two-sided sign-flip permutation p-value (20,000 draws, never 0), Holm-adjusted within its family of 16 tests (8 frameworks x 2 contrasts): bridge - direct and pooled - zero-shot are the pre-specified family; the two nested-LOO contrasts are a second, exploratory family. * = Holm p < 0.05.
| test framework | bridge - direct | pooled - zero-shot | nested LOO - zero-shot | nested LOO - pooled |
|---|---|---|---|---|
| CIS v8 | +0.258 [+0.206, +0.312], Holm p 8.0e-04 * | +0.020 [-0.022, +0.064], Holm p 1 | +0.162 [+0.101, +0.222], Holm p 8.0e-04 * | +0.142 [+0.092, +0.193], Holm p 8.0e-04 * |
| NIST 800-53 | +0.086 [+0.053, +0.121], Holm p 8.0e-04 * | +0.028 [-0.009, +0.060], Holm p 0.7 | +0.172 [+0.118, +0.227], Holm p 8.0e-04 * | +0.144 [+0.097, +0.193], Holm p 8.0e-04 * |
| AWS | +0.072 [+0.028, +0.123], Holm p 0.068 | +0.189 [+0.101, +0.290], Holm p 0.0026 * | +0.102 [+0.034, +0.173], Holm p 0.096 | -0.087 [-0.188, +0.002], Holm p 0.6 |
| Azure | +0.062 [+0.003, +0.131], Holm p 0.41 | +0.041 [-0.019, +0.107], Holm p 1 | -0.008 [-0.066, +0.047], Holm p 0.81 | -0.048 [-0.109, +0.011], Holm p 0.63 |
| GCP | +0.026 [-0.019, +0.067], Holm p 1 | +0.119 [+0.054, +0.182], Holm p 0.0033 * | +0.071 [+0.002, +0.129], Holm p 0.3 | -0.048 [-0.124, +0.025], Holm p 0.8 |
| M365 | +0.011 [-0.036, +0.055], Holm p 1 | +0.116 [+0.055, +0.179], Holm p 0.0026 * | +0.338 [+0.256, +0.422], Holm p 8.0e-04 * | +0.222 [+0.145, +0.304], Holm p 8.0e-04 * |
| CRI-2.1 | +0.218 [+0.140, +0.297], Holm p 8.0e-04 * | +0.026 [-0.020, +0.076], Holm p 1 | -0.022 [-0.054, +0.009], Holm p 0.8 | -0.048 [-0.096, -0.003], Holm p 0.37 |
| CSA-CCM-4.1 | +0.115 [+0.050, +0.177], Holm p 0.013 * | +0.071 [+0.029, +0.116], Holm p 0.019 * | +0.110 [+0.043, +0.176], Holm p 0.019 * | +0.039 [-0.021, +0.100], Holm p 0.8 |
- bridge - direct: interval above 0 on 6 of 8 (CIS v8, NIST 800-53, AWS, Azure, CRI-2.1, CSA-CCM-4.1), below 0 on 0; Holm p < 0.05 (m = 16): 4 of 8 positive (CIS v8, NIST 800-53, CRI-2.1, CSA-CCM-4.1), 0 negative (-).
- pooled - zero-shot: interval above 0 on 4 of 8 (AWS, GCP, M365, CSA-CCM-4.1), below 0 on 0; Holm p < 0.05 (m = 16): 4 of 8 positive (AWS, GCP, M365, CSA-CCM-4.1), 0 negative (-).
- nested LOO - zero-shot: interval above 0 on 6 of 8 (CIS v8, NIST 800-53, AWS, GCP, M365, CSA-CCM-4.1), below 0 on 0; Holm p < 0.05 (m = 16): 4 of 8 positive (CIS v8, NIST 800-53, M365, CSA-CCM-4.1), 0 negative (-).
- nested LOO - pooled: interval above 0 on 3 of 8 (CIS v8, NIST 800-53, M365), below 0 on 1; Holm p < 0.05 (m = 16): 3 of 8 positive (CIS v8, NIST 800-53, M365), 0 negative (-).
Single-source transfer matrix, MAP@200 (MiniLM-L6-v2); first row = zero-shot bridge
Diagonal = leave-one-out with weights tuned on the same folds (optimistic; the nested LOO column above is the honest in-framework estimate, and the figure shows nested LOO on the diagonal).
| train / test | CIS v8 | NIST 800-53 | AWS | Azure | GCP | M365 | CRI-2.1 | CSA-CCM-4.1 |
|---|---|---|---|---|---|---|---|---|
| zero-shot | 0.383 | 0.191 | 0.153 | 0.160 | 0.104 | 0.126 | 0.354 | 0.269 |
| CIS v8 | 0.550 | 0.220 | 0.170 | 0.120 | 0.130 | 0.160 | 0.322 | 0.224 |
| NIST 800-53 | 0.371 | 0.367 | 0.177 | 0.128 | 0.137 | 0.150 | 0.329 | 0.217 |
| AWS | 0.239 | 0.171 | 0.277 | 0.200 | 0.186 | 0.200 | 0.247 | 0.230 |
| Azure | 0.325 | 0.184 | 0.227 | 0.195 | 0.158 | 0.172 | 0.329 | 0.271 |
| GCP | 0.247 | 0.171 | 0.239 | 0.173 | 0.180 | 0.196 | 0.270 | 0.222 |
| M365 | 0.191 | 0.136 | 0.183 | 0.114 | 0.171 | 0.477 | 0.197 | 0.181 |
| CRI-2.1 | 0.370 | 0.192 | 0.200 | 0.145 | 0.135 | 0.263 | 0.363 | 0.294 |
| CSA-CCM-4.1 | 0.320 | 0.184 | 0.207 | 0.175 | 0.142 | 0.162 | 0.330 | 0.393 |
Labels-only prior (train framework's technique frequencies), MAP@200 (MiniLM-L6-v2):
| train / test | CIS v8 | NIST 800-53 | AWS | Azure | GCP | M365 | CRI-2.1 | CSA-CCM-4.1 |
|---|---|---|---|---|---|---|---|---|
| CIS v8 | 0.162 | 0.155 | 0.066 | 0.068 | 0.059 | 0.046 | 0.129 | 0.079 |
| NIST 800-53 | 0.142 | 0.161 | 0.125 | 0.086 | 0.103 | 0.062 | 0.135 | 0.108 |
| AWS | 0.073 | 0.104 | 0.231 | 0.169 | 0.149 | 0.164 | 0.096 | 0.086 |
| Azure | 0.087 | 0.100 | 0.190 | 0.150 | 0.121 | 0.118 | 0.097 | 0.082 |
| GCP | 0.074 | 0.099 | 0.198 | 0.144 | 0.153 | 0.153 | 0.090 | 0.101 |
| M365 | 0.063 | 0.077 | 0.137 | 0.092 | 0.132 | 0.350 | 0.092 | 0.074 |
| CRI-2.1 | 0.126 | 0.130 | 0.091 | 0.086 | 0.084 | 0.085 | 0.136 | 0.111 |
| CSA-CCM-4.1 | 0.089 | 0.100 | 0.127 | 0.091 | 0.113 | 0.119 | 0.119 | 0.169 |
Fitted weights (beta = kNN label transfer, gamma = prior): CIS v8: 0.5/0.0; NIST 800-53: 0.5/0.0; AWS: 0.25/0.25; Azure: 0.25/0.0; GCP: 0.0/0.5; M365: 1.0/0.1; CRI-2.1: 0.25/0.0; CSA-CCM-4.1: 0.5/0.0; pooled -> CIS v8: 0.5/0.1; pooled -> NIST 800-53: 0.5/0.0; pooled -> AWS: 0.5/0.0; pooled -> Azure: 0.5/0.0; pooled -> GCP: 0.5/0.0; pooled -> M365: 0.5/0.0; pooled -> CRI-2.1: 1.0/0.0; pooled -> CSA-CCM-4.1: 0.5/0.0
NIST 800-53 zero-shot MAP@200, full OSCAL statement vs CTID title only: TF-IDF: 0.214 vs 0.197; MiniLM-L6-v2: 0.191 vs 0.183
Per-control AP@200 for every method: results/crossframework_per_control.csv.gz.
Wall time: 232 s (TF-IDF, MiniLM-L6-v2).
Source: GitHub Actions realdata run 37092934843 at commit 6ff466dd6215 (Linux-6.17.0-1022-azure-x86_64-with-glibc2.39, Python 3.12.14).
5. Comparison with published work
See also Related work.
Comparison with published auto-mapping work
There is no directly comparable published benchmark for control text -> ATT&CK ranking under our setup. The table puts VANTAGE's numbers next to the closest published work and lists every difference. It is context, not a head-to-head result.
| system | ground truth | metric | value |
|---|---|---|---|
| Lee et al. 2026, SBERT + ATT&CK mitigations ensemble (published) | CTID NIST 800-53 mapping as 'silver standard', K-RMF control text | Recall@restricted (paper's own calibrated metric) | 0.74 (as reported) |
| VANTAGE direct text match (TF-IDF) | CTID NIST 800-53 rev5, 109 controls | R@10 / R@50 / MAP@200 | 0.057 / 0.173 / 0.091 |
| VANTAGE mitigation bridge, zero-shot (TF-IDF) | CTID NIST 800-53 rev5, 109 controls | R@10 / R@50 / MAP@200 | 0.105 / 0.316 / 0.214 |
| VANTAGE TransferMapper, trained on the 7 other frameworks (TF-IDF) | CTID NIST 800-53 rev5, 109 controls | R@10 / R@50 / MAP@200 | 0.155 / 0.384 / 0.258 |
| VANTAGE direct text match (MiniLM-L6-v2) | CTID NIST 800-53 rev5, 109 controls | R@10 / R@50 / MAP@200 | 0.085 / 0.238 / 0.105 |
| VANTAGE mitigation bridge, zero-shot (MiniLM-L6-v2) | CTID NIST 800-53 rev5, 109 controls | R@10 / R@50 / MAP@200 | 0.109 / 0.254 / 0.191 |
| VANTAGE TransferMapper, trained on the 7 other frameworks (MiniLM-L6-v2) | CTID NIST 800-53 rev5, 109 controls | R@10 / R@50 / MAP@200 | 0.118 / 0.324 / 0.219 |
| TRAM (CTID), CTI sentence classifier (published) | TRAM-labelled CTI report sentences, about 50 techniques | micro-F1 on sentences | different task: not comparable |
Setup differences:
- Lee et al. 2026 (Electronics 15(6):1248, doi:10.3390/electronics15061248) is the closest published setup and the prior art for routing through ATT&CK mitigations. Its headline metric, Recall@restricted, is defined in the full text, which we could not retrieve (HTTP 403 from both MDPI and preprints.org); the abstract says only that it is 'calibrated' for the coverage limits of the CTID silver standard. Without its exact definition (restriction set, cut-off k) no number here should be read as better or worse than 0.74.
- Control text: they use Korean RMF (K-RMF) control text; we use the NIST OSCAL rev5 control statements.
- ATT&CK release: CTID labels target v16.1; we carry them to v19.2 and rank only techniques that existed in v16.1 (653 candidates).
- Model: they use an SBERT ensemble; the numbers above use the encoder named in the row.
- TRAM classifies CTI report sentences into about 50 techniques; its published scores come from a private 2023 dataset with unseeded splits, so there is no matching setup for control text.
The VANTAGE rows are read from results/crossframework.json (run 37092934843 at commit 6ff466dd6215).
Source: GitHub Actions realdata run 37092934843 at commit 6ff466dd6215 (Linux-6.17.0-1022-azure-x86_64-with-glibc2.39, Python 3.12.14).
6. Numbers on the How-it-works page
How-it-works walkthrough (synthetic Acme posture, real catalog)
| technique | claimed by (IG2 safeguards) | live rules | dead rules (deployed, log source missing) | most common missing source | status |
|---|---|---|---|---|---|
| T1003.001 OS Credential Dumping: LSASS Memory | 14 | 7 | 61 | windows/process_creation (28) |
defended |
| T1055 Process Injection | 7 | 0 | 29 | windows/process_creation (12) |
paper_only |
Matrix: claimed 53.9% vs defended 17.6% of 697 techniques, 253 paper-only, 2132 dead rules. Top single point of failure: log_source windows/security (39 techniques go dark).
Recommender's first pick: onboard windows/ps_script (cost 1.15), which unlocks 134 rules and makes 51 techniques newly detectable. Defended coverage goes from 123 (17.6%) to 153 (22.0%) techniques, +30 (152 if only the posture's already-deployed rules come alive). The recommender maximises newly detectable techniques, not defended ones.
Source: GitHub Actions realdata run 37092934843 at commit 6ff466dd6215 (Linux-6.17.0-1022-azure-x86_64-with-glibc2.39, Python 3.12.14).