Evaluation¶
All numbers come from committed JSON in results/,
produced by the scripts in scripts/; the
Reproduce page lists the exact commands, and every result file carries a provenance block
(commit, command, UTC time; the GitHub Actions run id for Actions jobs). Some numbers got worse in this
revision; they are marked (worse) and explained.
Methodology¶
Data. EMBER 2018 (feature version 2) pre-extracted features, no binaries. Training uses a
deterministic 50 % sha256-prefix subsample of the 600k labelled training rows
(prepare_ember.py --train-frac 0.5, chosen to fit 16 GB RAM): 319,336 rows; 2018-10 is held out
for calibration and 275,732 rows are used to fit (this includes 27,370 benign files first seen
2006-12 to 2017-12, ember_secondary.json). The test set is all 200,000 labelled Nov-Dec 2018 files
(50 % malware). EMBER2024 (Win32, feature version 3) is a sha256-range subsample sized for
bandwidth and RAM: the first 8 MiB of each of the 64 weekly files (about 7 % of the paper's Win32
split, 135,423 labelled files; train weeks 0-51, test weeks 52-63; 43.5 % of the 27,715 test files
and 46.4 % of the training files are malicious, against 50 % in the paper). v3 records are translated
to the v2 schema (vitrine/ember3.py; approximations listed in results/ember2024_drift.json).
Metrics. ROC AUC; TPR at 1 % and 0.1 % FPR read off the test ROC (the literature's convention: the threshold is picked on the test set); and FPR / recall at a threshold calibrated on held-out data, which is what a deployed model would see.
Uncertainty. 95 % stratified-bootstrap percentile intervals (1,000 resamples unless stated; 300 in
the older ember_ci.json), pooled over 3 training seeds where models were retrained, so they include
seed variance. Point estimates are plug-in values (mean over seeds). Differences of two models on one
test set are paired (same resamples); the drop of one model between two test sets resamples the two
sets independently. Rates on fixed samples use Wilson intervals; zero-event rates the rule of three.
Adversarial comparisons use exact McNemar tests; the YARA comparison a family-level bootstrap and an
exact sign-flip test.
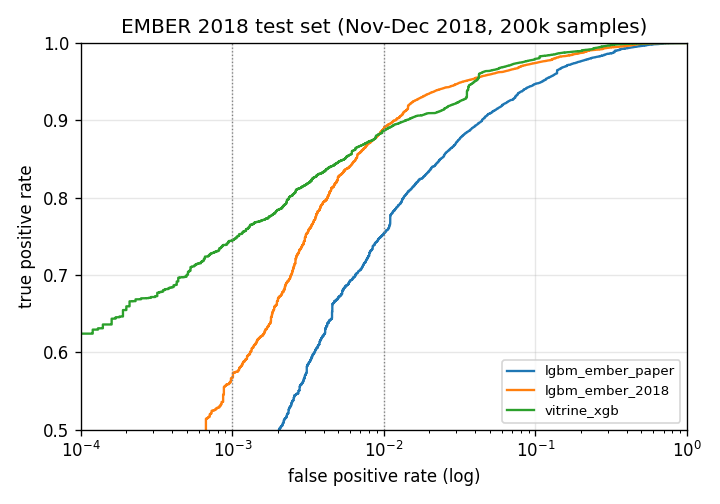
1. Verdict model vs published and reproduced baselines (EMBER 2018)¶
| Model | Features | Train rows | ROC AUC (95 % CI) | TPR @ 1 % FPR (95 % CI) | TPR @ 0.1 % FPR (95 % CI) |
|---|---|---|---|---|---|
Published EMBER 2018 model (authors' ember_model_2018.txt, 1,000 trees), scored by us on the same test rows |
2,381 hashed | all ~600k labelled (authors) | 0.9964 (0.9962-0.9966) | 96.5 % (96.3-96.6) | 87.0 % (86.0-88.8) |
| VITRINE XGBoost (600 trees, depth 10), 3 seeds, seed-pooled | 91 named | 275,732 (50 % subsample) | 0.9914 (0.9908-0.9922) | 88.2 % (87.8-88.8) | 74.2 % (72.7-75.8) |
| VITRINE XGBoost, seed 0 (the saved triage model) | 91 named | 275,732 | 0.9917 (0.9915-0.9920) | 88.7 % (88.2-89.0) | 74.5 % (73.3-75.7) |
| LightGBM, EMBER-2018 config, 300 rounds (our run) | 2,381 hashed | 150,000 | 0.9901 (0.9898-0.9905) | 89.0 % (88.2-89.4) | 56.8 % (53.2-59.0) |
| LightGBM, paper defaults, 100 trees (our run) | 2,381 hashed | 150,000 | 0.9797 (0.9792-0.9802) | 75.4 % (74.7-76.0) | 38.9 % (37.0-40.3) |
| Published, EMBER 2017 paper [1], EMBER 2017 test set | 2,351 | 600k | 0.99911 | 98.2 % | 92.99 % |
EMBER 2017 paper setup, reproduced by us (elastic/ember@d97a0b5, feature v1, LightGBM defaults, ember2017_repro.json) |
2,351 | 600k | 0.99911 (0.99905-0.99917) | 98.2 % (98.1-98.3) | 93.0 % (92.5-93.3) |
| VITRINE on EMBER 2017 | - | - | n/a: v1 records lack the data directories VITRINE's features need |
The EMBER 2017 rows use a different dataset from the rest of this table. The reproduction ran in GitHub
Actions (run 37005292317,
.github/workflows/ember2017.yml at 36fc89a: sha256-checked 1.67 GB feature archive, paper-era
scikit-learn 0.24 / LightGBM 2.3.1, 25 min); all three paper values lie inside its 95 % CIs.
(worse) Paired difference VITRINE XGBoost − published model, plug-in point and bootstrap 95 % CI
(results/ember_secondary.json): seed-pooled over 3 seeds AUC −0.0050 (−0.0056 to −0.0043), TPR @ 1 % FPR −8.3 (−8.7 to −7.8) pt, TPR @ 0.1 % FPR −12.8 (−14.8 to −11.2) pt; seed 0 alone AUC −0.0047 (−0.0049 to −0.0045), TPR @ 1 % FPR −7.8 (−8.3 to −7.5) pt, TPR @ 0.1 % FPR −12.5 (−14.4 to −11.2) pt. Our score for
the published model is consistent with the authors' notebook (0.99643 AUC, 96.5 % / 86.8 %) within
its CI. Caveat: it was scored on VITRINE's clean-room v2 vectors, whose 50 entry-section-name hash
dimensions differ from elastic/ember's (whole name vs per character).
The gap to the published model mixes data and representation. Earlier revisions compared VITRINE only with our memory-limited 150k-row LightGBM runs and called the cost of interpretability "small". The published model saw about twice the labelled rows and used 1,000 trees, and this revision does not separate data from representation, so the gap is not a measured cost of interpretability alone. On identical 150k rows (3-seed mean ± sd, descriptive) XGBoost is ahead of the tuned LightGBM at 0.1 % FPR (70.9 ± 0.4 % vs 56.8 %) and behind at 1 % FPR (86.9 ± 1.6 % vs 89.0 %).
The published model was trained on 2018-10, so a threshold "calibrated" on that month is leaked (it lands near 1e-4 and gives 18 % test FPR); it is kept only as a labelled diagnostic.
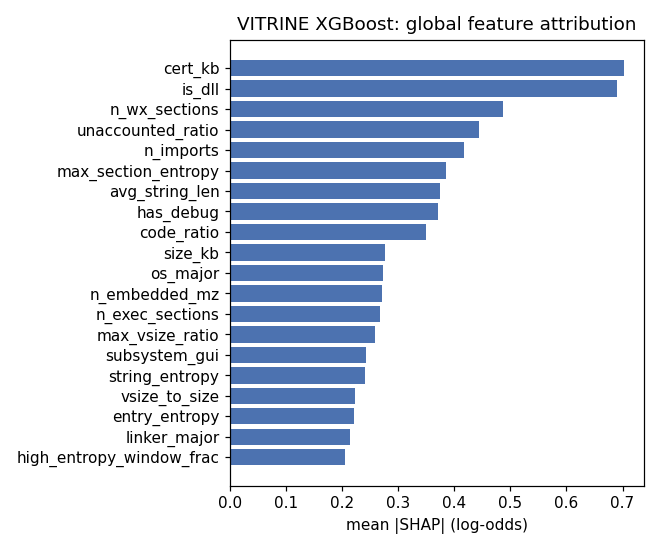
SHAP faithfulness¶
| Check (2,000 test malware; intervals: bootstrap over samples) | Result |
|---|---|
| Additivity: max |Σ SHAP − margin| | 1.7e-5 log-odds |
| Deletion: replace top-k SHAP features with the benign median | score drop 0.087 (0.079-0.095) / 0.224 (0.212-0.235) / 0.335 (0.322-0.349) / 0.532 (0.517-0.547) for k = 1 / 3 / 5 / 10 |
| Same with k random features | 0.003 (0.001-0.005) / 0.008 (0.005-0.011) / 0.009 (0.006-0.012) / 0.019 (0.014-0.023) |
| Ratio top-k / random-k | 29 (18-65) / 30 (22-46) / 37 (27-57) / 28 (23-37) |
Packed vs unpacked¶
20.8 % of the test set trips the packing heuristics (75.1 % of those are malware). AUC is higher on
the packed subset for every model (VITRINE 0.9965 vs 0.9897 unpacked, difference +0.0068 (+0.0064 to +0.0073); LightGBM EMBER-2018 config 0.9953 vs 0.9881 unpacked, difference +0.0072 (+0.0066 to +0.0078); LightGBM paper defaults 0.9905 vs 0.9753 unpacked, difference +0.0153 (+0.0143 to +0.0162)), so packing does not starve the model overall. The
routing rationale is the benign side: at each model's validation-calibrated 1 % FPR threshold, packed
benign files are flagged VITRINE 1.9 % (1.7-2.2) vs 0.8 % unpacked; LightGBM EMBER-2018 config 2.3 % (2.0-2.6) vs 0.6 % unpacked; LightGBM paper defaults 2.0 % (1.8-2.3) vs 0.8 % unpacked (ember_secondary.json), and static evidence alone cannot clear
them.
2. Cross-time: EMBER 2018 ↔ EMBER2024¶
XGBoost on the 91 named features, 3 seeds per training set, 1,000-resample bootstrap pooled over
seeds for every column (scripts/bench_drift.py, results/ember2024_drift.json). "2018 (99k)" is the
2018 model retrained on a random 99,144 rows, the same size as the 2024 training set, so "older data"
is not confused with "less data". The last two columns use the threshold calibrated to 1 % FPR on the
source period's held-out data (2018-10, or 2024 weeks 48-51).
| Train → test | ROC AUC | TPR @ 1 % FPR | TPR @ 0.1 % FPR | FPR at source threshold | Recall at source threshold |
|---|---|---|---|---|---|
| 2018 (276k) → 2018 test | 0.9914 (0.9908-0.9922) | 88.2 % (87.8-88.8) | 74.2 % (72.7-75.8) | 0.93 % (0.85-1.00) | 88.0 % (87.5-88.4) |
| 2018 (276k) → 2024 test | 0.9730 (0.9710-0.9748) | 74.2 % (71.4-76.6) | 60.5 % (56.9-65.0) | 0.07 % (0.02-0.14) | 58.6 % (57.7-59.6) |
| 2018 (99k) → 2018 test | 0.9878 (0.9871-0.9884) | 84.1 % (83.7-84.7) | 68.9 % (66.2-70.3) | 0.99 % (0.87-1.08) | 84.2 % (83.9-84.7) |
| 2018 (99k) → 2024 test | 0.9712 (0.9689-0.9738) | 73.8 % (72.7-75.0) | 60.1 % (57.6-63.6) | 0.02 % (0.00-0.04) | 51.7 % (49.1-53.7) |
| 2024 (99k) → 2024 test | 0.9946 (0.9940-0.9951) | 91.1 % (90.2-91.9) | 78.5 % (74.7-81.2) | 1.18 % (0.99-1.40) | 91.8 % (91.3-92.3) |
| 2024 (99k) → 2018 test | 0.8860 (0.8810-0.8895) | 33.3 % (32.3-34.3) | 1.7 % (0.6-3.9) | 44.8 % (44.1-45.6) | 95.5 % (95.4-95.7) |
| Published EMBER 2018 model → 2024 test (one fixed model; threshold = 1 % FPR on the 2018 test) | 0.9833 (0.9823-0.9843) | 80.0 % (78.8-81.1) | 72.8 % (71.8-73.7) | 0.006 % (1 of 15,672; 0.001-0.04 %) | 68.5 % (67.7-69.4) |
The drop, with intervals (same models, 2018 test minus 2024 test, independent resamples): AUC −0.0184 (−0.0205 to −0.0161), recall at the source threshold −29.3 pt (−30.5 to −28.3), FPR at the source threshold −0.86 pt (−0.93 to −0.78). Paired, same size, on the 2024 test set: the in-period 2024 model beats the 2018 model by +0.023 AUC (+0.021, +0.026) and +17.3 pt TPR @ 1 % FPR (+15.9, +18.6).
Reading. The 2018 → 2024 shift (time plus collection, extractor and schema changes) degrades a 2018 static model silently: AUC falls by 0.018 and, at its own calibrated threshold, recall drops from 88 % to 59 % while the false-positive rate falls (0.07 %), so nothing in its alert volume signals the problem. This is not specific to named features: the EMBER authors' hashed-feature 2018 model drops 0.0131 (0.0119-0.0142) AUC on the same 2024 rows and, at its 2018-test 1 % FPR threshold, keeps 68.5 % recall with one false positive. The reverse direction fails loudly: a 2024 model flags 45 % of 2018 test benign files at its own threshold, so old benign software looks malicious to it. Across the 64 EMBER2024 weeks the 2018 model's AUC ranges 0.918 (week 32; 95 % band 0.906-0.928) to 0.992 (week 17; 0.989-0.995); TESSERACT-style AUT of the weekly curve: 0.970.
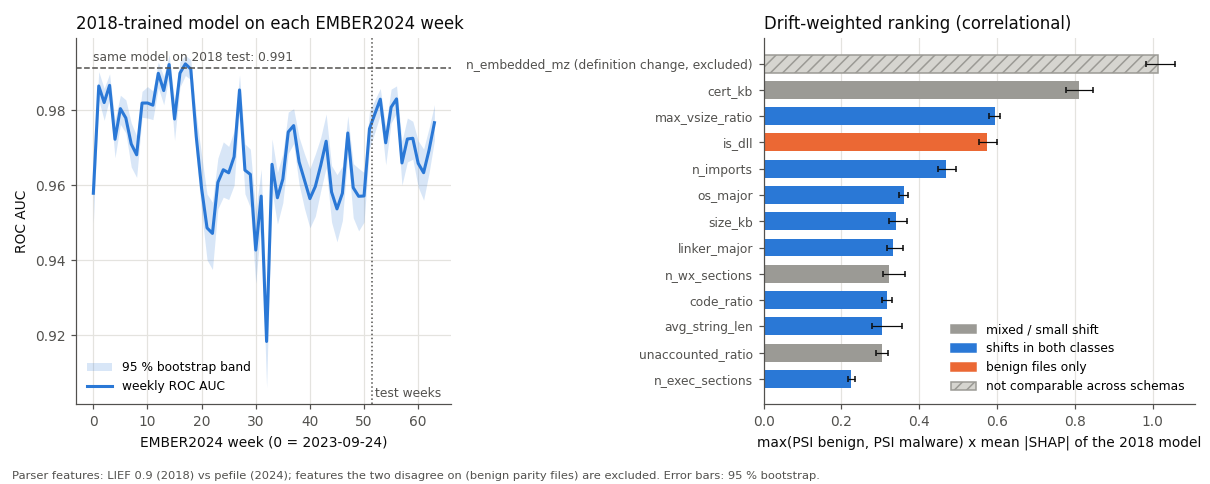
Which named features shift: a correlational ranking¶
Ranking. Per feature and class, PSI between the 2018 and 2024 test sets on point-mass-aware bins (every value holding at least 10 % of the reference gets its own bin, the rest reference deciles), weighted by the 2018 model's mean |SHAP|: weight = max(PSI benign, PSI malware) × mean |SHAP|. The bootstrap (200 resamples of both test sets and of the SHAP rows) gives intervals for PSI, weights and ranks. This is a correlational ranking, not a causal attribution.
Which features can be compared at all. Two audits decide this (ember2024_drift_parity.json,
extractor_parity.json):
- Definitions. 4 string counters are redefined (v3 has only the nearest regex) and 6 flags are
proxies.
n_embedded_mz, the top raw-PSI feature, counts the bytesMZanywhere in a file in v2 and strings containing!This programin v3. On 600 System32 files (Windows Server 2022 Actions runner) the two definitions agree exactly on 13.7 % (11.1-16.6) of files (total variation 0.86 (0.83-0.89)); its rank is a definition change, not drift. (The PSI between the two definitions, 8.4 (7.9-8.9), depends on the share floor, 6.4 at a 1e-3 floor to 12.4 at 1e-6, so it is not the headline number.) - Extractors. EMBER 2018 was extracted by LIEF 0.9 and EMBER2024 by pefile (thrember). A
GitHub Actions job (run 37092793271,
.github/workflows/extractor-parity.yml) runs both extractors on the same 1,069 benign DLL/PYD/EXE files unpacked from 70 PyPI Windows wheels (42 % PE32; parsed only, never executed or committed). Header, import, export, size and byte-level features agree on at least 99 % of files, but the section-entropy features do not: LIEF and pefile agree within 1 % on 13 % (mean section entropy), 53 % (min), 69 % (max) and 82 % (entry entropy) of files, with extractor-only PSI up to 0.81 (0.62-1.29;min_section_entropy). These, and four other parser features below 99 % agreement, are classed extractor-sensitive and leave the comparable set. The corpus is benign open-source software, not EMBER's files or packed malware, so agreement here is necessary, not sufficient.
Ranking of the faithful features (top 10, ember2024_drift.json; 200 bootstrap resamples):
| # | Feature | Group | Shift | PSI benign (95 % CI) | PSI malware (95 % CI) | Weight (95 % CI) | Rank (95 % CI) | P(top 10) |
|---|---|---|---|---|---|---|---|---|
| 1 | cert_kb |
header | mixed | 1.17 (1.12-1.21) | 0.20 (0.18-0.24) | 0.812 (0.776-0.847) | 1 | 1.00 |
| 2 | max_vsize_ratio |
sections | both classes | 0.44 (0.42-0.46) | 2.23 (2.19-2.26) | 0.594 (0.580-0.607) | 2-3 | 1.00 |
| 3 | is_dll |
header | benign only | 0.86 (0.83-0.89) | 0.00 (0.00-0.00) | 0.575 (0.553-0.600) | 2-3 | 1.00 |
| 4 | n_imports |
imports | both classes | 0.92 (0.88-0.97) | 1.08 (1.04-1.14) | 0.468 (0.449-0.494) | 4 | 1.00 |
| 5 | os_major |
header | both classes | 1.41 (1.36-1.45) | 0.98 (0.94-1.02) | 0.360 (0.347-0.371) | 5-6 | 1.00 |
| 6 | size_kb |
bytes strings | both classes | 0.27 (0.25-0.29) | 1.28 (1.21-1.37) | 0.341 (0.323-0.368) | 5-9 | 1.00 |
| 7 | linker_major |
header | both classes | 1.68 (1.59-1.80) | 0.89 (0.85-0.92) | 0.334 (0.316-0.359) | 6-10 | 1.00 |
| 8 | n_wx_sections |
sections | mixed | 0.19 (0.17-0.20) | 0.65 (0.61-0.72) | 0.323 (0.306-0.362) | 5-10 | 0.99 |
| 9 | code_ratio |
header | both classes | 0.95 (0.91-0.99) | 0.65 (0.58-0.79) | 0.318 (0.305-0.331) | 7-10 | 0.98 |
| 10 | avg_string_len |
bytes strings | both classes | 0.57 (0.55-0.60) | 0.77 (0.70-0.90) | 0.305 (0.278-0.355) | 6-11 | 0.55 |
9 of the 10 are in the top 10 in at least 95 % of the resamples. The top 10 is robust to the binning and to the dominant family: it overlaps the primary list in 9/10 (legacy deciles), 9/10 (pooled quantiles), 8/10 (excl xtrat); the last control drops xtrat (19 % of the 2018 test malware, 0 % of 2024's). 6 features are in every variant's top 10: cert_kb, is_dll, n_imports, os_major, linker_major, code_ratio. Benign-side shifts (signing size, DLL share) read as collection and selection artifacts, both-class shifts (section virtual-size ratio, import count, OS and linker versions, size) as toolchain change; that reading is a hypothesis, not a measurement.
(negative result) Removal. Retraining the 2018 model (99,144 rows, 3 seeds) without the faithful top 10 changes 2024-test AUC by −0.0018 (−0.0033 to −0.0003), 2024-test TPR @ 1 % FPR by −4.9 (−6.8 to −3.1) pt and 2018-test AUC by −0.0033 (−0.0046 to −0.0023) (paired bootstrap). It does not help on 2024. Against 100 group-matched random removals of 10 faithful features, each compared with the full and top-10 models of the same seed (Monte Carlo p that the top-10 removal is at least as damaging as chance): on 2024 AUC it is ordinary (46 of 100 draws hurt more; random mean −0.0016, 2.5-97.5 % of draws −0.0050 to +0.0014; p = 0.47), while on 2024 TPR @ 1 % FPR (0 of 100; p = 0.01) and on 2018 AUC (0 of 100; p = 0.01) it hurts more than any random draw: the ranked features carry signal in both periods, and dropping them does not recover robustness (ember2024_drift_parity.json, GitHub Actions run 37117414731, job parity).
Oracle alignment. An oracle intervention on the frozen 2018 models (3 seeds): per class, 2024 test values of a feature group are quantile-mapped onto the 2018 test marginal (within-class ranks kept; it uses the labels, so it is an analysis tool, not a correction), and the 2024 test is re-scored (paired bootstrap, 1,000 resamples pooled over seeds). The models were retrained in the Actions job with bench_drift.py's recipe and score 0.9913 on 2018 and 0.9735 on 2024 (the committed bench_drift.py models: 0.9914 and 0.9730). Change in 2024 AUC after alignment:
| Aligned group | Features | Δ AUC on 2024 (95 % CI) | Share of the 2018 → 2024 drop |
|---|---|---|---|
| faithful top 10 | 10 | −0.0166 (−0.0204 to −0.0130) | −93 % |
| all 91 features | 91 | −0.0469 (−0.0504 to −0.0432) | −264 % |
| all faithful features | 72 | −0.0261 (−0.0298 to −0.0229) | −147 % |
| redefined and proxy features | 19 | −0.0098 (−0.0114 to −0.0084) | −55 % |
best single top-10 feature, size_kb |
1 | +0.0036 (+0.0032 to +0.0043) | +20 % |
worst single top-10 feature, n_wx_sections |
1 | −0.0082 (−0.0089 to −0.0076) | −46 % |
n_embedded_mz alone |
1 | −0.0012 (−0.0017 to −0.0008) | −7 % |
(negative result) Aligning the ranked features does not recover the drop but lowers 2024 AUC further, by 0.0166 (0.0130-0.0204), 93 % of the drop's size; 20 of 20 group-matched random sets of 10 faithful features end with at least the 2024 AUC of the top 10 (mean −0.0016, 2.5-97.5 % of draws −0.0088 to +0.0044; Monte Carlo p = 1.00 for "the top 10 recovers more"). Only 2 of the 10 single features raise 2024 AUC when aligned alone. Marginal alignment keeps the 2024 dependence between features, so the aligned rows are combinations the 2018 models were not trained on: the shift is not a marginal-only one, and the ranking does not identify features whose 2018 marginals would restore the model. GitHub Actions run 37117414731 (.github/workflows/drift-heavy.yml, job align), results/ember2024_drift_align.json.
Confounds. 2018 → 2024 mixes temporal drift with a dataset change: different collection (EMBER 2018 was selected to be harder), extractor (LIEF 0.9 vs pefile, audited above on benign files only) and the v3 → v2 translation. The within-2024 translation control is in section 3.
3. EMBER2024 baselines (paper vs released model vs ~7 % retrain)¶
Test set: our 27,715-file subsample of the 12 EMBER2024 Win32 test weeks (43.5 % malicious;
scripts/bench_ember2024.py, results/ember2024_baselines.json). The paper reports the full test
split (360,000 Win32 files, 50 % malicious).
| Model | Train rows | ROC AUC (95 % CI) | TPR @ 1 % FPR (95 % CI) | TPR @ 0.1 % FPR (95 % CI) |
|---|---|---|---|---|
| Paper (Joyce et al. 2025, Table 5), Win32 → Win32, full test split | 1.56M (Win32 train, paper Table 3) | 0.9984 | - | - |
Released EMBER2024_Win32.model, scored by us on our subsample |
1.56M (authors) | 0.9983 (0.9980-0.9985) | 97.4 % (96.9-97.7) | 89.7 % (88.4-92.3) |
Paper config (lgbm_config.json), retrained by us, native v3 (2,568 dims), 3 seeds |
107,708 (~7 %) | 0.9966 (0.9961-0.9970) | 94.7 % (94.0-95.3) | 85.3 % (82.8-87.9) |
| Same config and rows, v3 → v2 translated (2,381 dims) | 107,708 | 0.9960 (0.9955-0.9965) | 93.9 % (93.2-94.6) | 83.8 % (81.0-86.6) |
| VITRINE XGBoost, 91 named features (translated), §2 | 99,144 | 0.9946 (0.9940-0.9951) | 91.1 % (90.2-91.9) | 78.5 % (74.7-81.2) |
The released model scored on our subsample is a consistency check with the paper's AUC; our own retrain on ~7 % of the paper's training rows does not reproduce 0.9984 (it is 0.0017 AUC behind the released model, 0.0014-0.0020). PR AUC is not compared: the paper's is at 50 % prevalence and our subsample is 43.5 % malicious. Translation control: on identical rows the v3 → v2 translation costs only 0.0006 AUC (0.0003-0.0008) and 0.8 pt TPR @ 1 % FPR (0.2-1.3), far less than the 0.017-0.018 AUC lost from 2018 to 2024 (276k and 99k models, §2). This shows that little information is lost inside 2024; it does not rule out definition or extractor mismatches across datasets (§2). The EMBER 2017 paper setup is reproduced exactly in §1.
4. Auto-YARA on real families (15 most frequent AVClass families)¶
Rules are synthesized from 400 training samples per family, tuned on a 16,392-file training benign
pool, and scored out of time on test siblings, all 100,000 test benign files and 2,999 System32 files
(the first 3,000 alphabetically; section 7 uses a different, random 3,000). Coverage is the mean of the
15 per-family coverages (abstention counts as 0), with a family-bootstrap 95 % CI (intervals.json).
| Generator | Rules | Mean per-family coverage (95 % CI) | Pooled over 63,389 siblings | Benign FPs / 100k test (Wilson 95 %) | System32 FPs |
|---|---|---|---|---|---|
| VITRINE structural (abstains on 7) | 8 | 16.8 % (2.1-35.0) | 38.0 % | 5 (2-12) | 0 |
| Imphash, benign-filtered on the same pool | 15 | 13.9 % (3.0-29.1) | 10.0 % | 7 (3-14) | 0 |
| Frequency, benign-filtered (yarGen principle) | 13 | 6.3 % (0.1-17.4) | 0.5 % | 44 (33-59) | 3 |
| Imphash, unfiltered | 15 | 21.0 % (6.0-39.1) | 39.7 % | 11,596 | 0 |
| Frequency, unfiltered | 15 | 20.4 % (7.8-36.4) | 15.0 % | 50,355 | 285 |
| Ablation: VITRINE without abstention (unfiltered fallback) | 15 | 25.5 % (9.9-44.2) | 44.0 % | 29,167 | 190 |
(worse) Reading. Against the like-for-like benign-filtered imphash baseline there is no
evidence of a difference: VITRINE's mean per-family coverage is +2.9 pt higher (family-bootstrap
95 % CI −11.0 to +20.2; exact sign-flip p = 0.75, Wilcoxon p = 0.91; VITRINE better on 4 families,
the baseline on 5). The whole lead is one family, xtrat (+97.6 pt); the filtered imphash rules win on
zbot, sality, flystudio, wapomi and upatre. Pooled over all siblings VITRINE covers 38.0 % against
10.0 %, but 78 % of VITRINE's hits are xtrat. Unfiltered imphash rules are not uniformly bad: 10,714 of
their 11,596 FPs come from one family ("high"). 4 of VITRINE's 8 rules catch almost nothing out of time
(installmonster, zusy, fareit, adposhel, all < 1 %). Per-family Wilson intervals: results/intervals.json.
5. Adversarial robustness (feature space, 3,000 test malware, 3 donor draws)¶
Detection rate at each score model's validation-calibrated 1 % FPR threshold, mean of 3 donor draws
over the same 3,000 test malware; Wilson 95 % CIs (n = 3,000) are about ±1.5-1.8 pt (intervals.json).
Donors are 3,770 import-rich benign files, 21.7 % of which themselves trip a high-risk capability.
VITRINE XGBoost is trained on 275,732 rows; both LightGBM models on 150,000.
| Perturbation | VITRINE XGB (276k rows) | LightGBM tuned (150k rows) | LightGBM paper (150k rows) | McNemar p, XGB vs tuned (draw 0) | Triage (score or floor), 11.7 % benign FPR | XGB score alone at 11.7 % FPR |
|---|---|---|---|---|---|---|
| none | 87.1 % | 86.5 % | 74.1 % | 0.36 | 89.4 % | 98.0 % |
| overlay | 77.5 % | 73.5 % | 64.3 % | 4e-9 | 81.1 % | 97.5 % |
| new section | 75.2 % | 70.7 % | 63.0 % | 4e-9 | 78.8 % | 97.3 % |
| import padding | 76.9 % | 78.4 % | 60.2 % | 0.046 | 85.4 % | 96.3 % |
| header copy | 79.1 % | 83.5 % | 70.6 % | 9e-8 | 82.4 % | 96.3 % |
| all combined | 39.9 % (38.1-41.6) | 44.1 % (42.4-45.9) | 36.6 % (34.9-38.3) | 9e-7 | 58.7 % (57.0-60.5) | 85.7 % (84.4-86.9) |
(worse) Reading. Results are mixed: named-feature XGBoost is more robust to overlay and section addition, LightGBM to header copying and the combined attack; import padding is close. The capability floor's apparent robustness was mostly an artefact: in the combined attack, 13.0 pt (11.8-14.2) of its 18.8 pt floor-only detections were switched on by the benign donor's own imports. With donors that trip no high-risk capability the triage column falls to 47.1 % (45.3-48.9). The floor is also expensive: the triage rule flags 11.7 % (11.5-11.9) of test benign files, and a plain score threshold at that FPR detects far more malware under every perturbation.
6. Family clustering (5,000 malware, 10 AVClass families)¶
k-means is given the true number of families (oracle k); HDBSCAN gets no such hint. Values are the
seed-0 sample; brackets give the 2.5-97.5 % range over 20 re-drawn samples (clustering.json).
| Embedding | Algorithm | Clusters | Noise | ARI (clustered points) | ARI (all points, noise as singletons) |
|---|---|---|---|---|---|
| 91 named → PCA20 | HDBSCAN | 40 | 33.6 % (28.9-34.1) | 0.578 (0.557-0.608) | 0.341 (0.334-0.390) |
| 91 named → PCA20 | k-means, oracle k = 10 | 10 | 0 | 0.478 (0.429-0.519) | same |
| EMBER 2381 → SVD20 | HDBSCAN | 31 | 32.7 % (32.7-35.2) | 0.660 (0.644-0.685) | 0.426 (0.408-0.428) |
| EMBER 2381 → SVD20 | k-means, oracle k = 10 | 10 | 0 | 0.246 (0.216-0.324) | same |
HDBSCAN's clustered points are 97.7 % single-family, but only after leaving a third unlabelled. Scored on all points, named-feature HDBSCAN is below oracle-k k-means in all 20 re-drawn samples (ARI difference −0.11, range −0.17 to −0.06); on the EMBER embedding it is above (+0.14, +0.10 to +0.20).
7. Real benign binaries and capability-tagger validation¶
3,000 random System32 files (2026 Windows 11), parsed by VITRINE's own dissector and scored by models trained on 2018 LIEF features: 0 / 2,999 false positives for every model at both thresholds (95 % upper bound about 0.1 %). The capability floor flags 102 (3.4 %, CI 2.8-4.1 %); those come from T1056.001 (3.0 %), T1105 (0.47 %) and the injection rules (≤ 0.13 %). The most frequent tags overall are T1622 70 %, T1027.007 49 %, T1112 41 %, T1071.001 23 %, T1106 16 %, T1055 11 %. The committed System32 run predates two URL filters: most of its T1071.001 tags came from manifest XML-namespace and Authenticode CRL/AIA URLs, which are no longer counted.
Capability tagger vs capa (EMBER2024)¶
On 46,275 EMBER2024 records with capa output (results/capabilities_ember2024.json, Wilson 95 % CIs
there), VITRINE's import rules agree where capa reports the same technique: T1134 precision 0.99 /
recall 0.81, T1529 0.99 / 0.97, T1112 0.75 / 0.91, T1057 0.96 / 0.34. Others disagree: T1055 "modify
memory protection" (VirtualProtect) has precision 0.08; capa rarely emits T1622 (42 records, against
27,631 VITRINE tags; against MBC B0001 VITRINE scores 0.62 / 0.70); T1106, T1095 and T1486 never appear
in capa's ATT&CK output. The packing heuristic vs AV packer tags: precision 0.22, recall 0.64. These
are agreement figures between two tools, not ground truth.