REVENANT
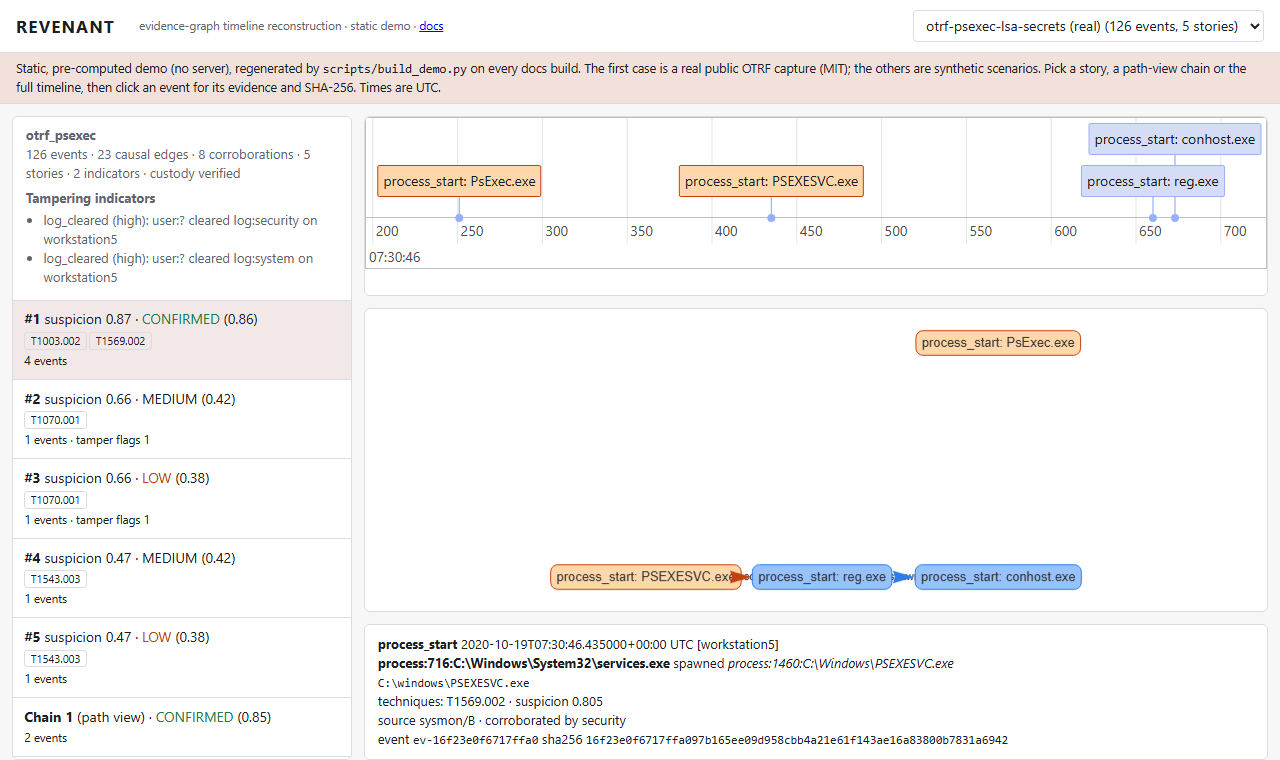
Forensic timeline reconstruction for DFIR: causal incident stories from Windows and Linux artefacts, every claim graded and cited by the SHA-256 of its evidence.
Contribution: REVENANT builds a causal provenance graph from forensic artefacts that lack process GUIDs using named, deterministic rules whose per-rule confidences are fitted against Sysmon-GUID lineage hidden at inference, and attaches the rule, its confidence and the hash of the supporting event to every claim it reports.
Open the live demo Try it in 60 seconds Evaluation
What the evidence shows
With GUIDs hidden, REVENANT's causal edges beat a PID-nearest analyst baseline on OTRF atomic but are at parity with a careful PID-then-image heuristic; calibration lowers the error of its edge confidences without improving their ranking; its stories do not speed up triage; and under the ATLAS protocol it scores far below ATLAS's hand-cleaned output. What it adds is explainability and custody, not accuracy. The table below is generated from the committed result files; each row names the workflow run behind it.
Headline results
| Benchmark (public data, ground truth) | REVENANT | Best baseline | Verdict | Source run |
|---|---|---|---|---|
| B1 causal edges, OTRF atomic (120 captures, 102 with scorable effects; Sysmon GUIDs hidden as a proxy for GUID-less sources) | F1 0.910 [0.79, 0.98]; macro 0.931 | PID-then-image-nearest 0.906 [0.78, 0.97]; macro 0.923 | macro difference vs PID-nearest +0.194 [+0.129, +0.266], sign test p=4.6e-07; vs PID-then-image +0.008 [-0.000, +0.025], p=0.289 | 37093169942 |
| B1, APT29 day 1 + day 2, LSASS (7), Log4Shell | F1 0.999-1.000 | PID-nearest 1.000-1.000 | no difference (fewer than 10 captures per corpus: no CI) | 37093169942 |
| Edge calibration, fit APT29 -> test atomic | ECE 0.098 [0.011, 0.260], AUROC 0.66 [0.42, 0.94] | hand-set ECE 0.233 [0.179, 0.300] | improved, not solved | 37093169942 |
| B2 story ranking, 107 labelled captures, equal budget | hit@1 0.28 [0.20, 0.37] | flat suspicion-sorted 0.36 [0.28, 0.46] | lower, not significant (McNemar p=0.064) | 37093169942 |
| B3 anti-forensics, EVTX-ATTACK-SAMPLES (10 positives) | recall 0.80 [0.49, 0.94], precision 0.25 [0.13, 0.42] | 1102/104 recall 0.30; Sigma-equivalent recall 0.60, precision 0.20 | vs Sigma-equivalent on positives 2/0 discordant, p=0.500 | 37093169942 |
| B3b anti-forensics, OTRF T1562.002 captures (17 positives) | recall 1.00 [0.82, 1.00], precision 0.29 [0.19, 0.42] | 1102/104 recall 0.29; Sigma-equivalent recall 1.00, precision 0.29 | vs Sigma-equivalent on positives 0/0 discordant, p=1.000 | 37093169942 |
C ATLAS paper, authors' release and evaluate.py |
event F1 0.9988, entity F1 0.913; model re-run (TF 2.3) identical predictions on 15/16 test graphs | paper 0.9988 / 0.9376 | recomputed: macro event figures match Table 4's average; per-attack event counts differ for 8 of 10 attacks | 37090608948 |
| C2 REVENANT under the ATLAS protocol (10 attacks) | entity F1 0.556 [0.46, 0.64], event F1 0.574 [0.49, 0.65] | ATLAS (hand-cleaned) 0.913 / 0.9988 | worse on 10/10 attacks (sign test p=0.002) | 37090608948 |
| B5 live auditd capture in CI (scripted benign sequence) | 7/7 chain checks; 25/25 edges agree [0.86, 1.00] | - | consistency check, not accuracy | 37093169673 |
ATLAS rows: each multi-host attack is scored from its h2 folder, where the authors' procedure puts both hosts' outputs (its event totals equal the paper's); M4_h1's release has no cleaned predictions, so evaluate.py stops there with an error. Event-level paper figures come from Table 4 (Avg row, p. 3016) and Table 5 (p. 3017), not the abstract.
Lab-only and defensive
REVENANT reads evidence and never changes it. It contains no offensive code. All benchmark data is public (see Datasets).
What it does
plaso/log2timeline produces a super-timeline with millions of undifferentiated rows, and
an analyst still has to build the story by hand. REVENANT reads real Windows and Linux
artefacts (Sysmon, Security, PowerShell, raw .evtx, plaso, Volatility 3, auth.log,
auditd, and ATLAS's preprocessed logs), turns events into nodes and adds typed causal edges
("process spawned process", "process wrote file", "logon → session", "dropped file executed").
Each edge comes from a named, deterministic rule with entity and time constraints. The graph is
then cut into incident stories, each with two separate scores:
- suspicion: how attack-like it is, from ATT&CK heuristics and per-case rarity;
- confidence: how well the evidence supports it, from source reliability, cross-artefact corroboration, temporal fit and calibrated per-rule edge precision. Tampering reduces it.
The report ends with a "What remains uncertain" section listing time windows with no artefact coverage and event types that were not interpreted, so gaps are not quietly filled. Every report records an append-only custody ledger whose head hash can be verified later.
Where next
- How it works: one real capture followed through every stage.
- Evaluation: methodology, every result with confidence intervals.
- ATLAS protocol mapping: how REVENANT is scored under ATLAS's own harness.
- Reproduce: exact commands, expected outputs and runtimes.
- Getting started and the CLI & API reference.
- Limitations & roadmap.