Evaluation
Every number on this page comes from results/*.json, produced by the scripts in benchmarks/ in one run of the manual bench workflow on a fresh GitHub-hosted runner, with every sibling engine at its pinned release (see the pinned versions in throughline/engines/__init__.py). Each result file records the engine versions and commits, the THROUGHLINE commit and the dataset pins it was produced with, and the workflow refuses results that are stale, over 1 MB, degenerate or produced by other engine commits. Reproduce has the commands and expected outputs.
Statistics. Intervals are 95%. Per-capture metrics: percentile bootstrap over captures (2,000 resamples, seed 0). Rates: Wilson score intervals (they do not collapse at 0 or 1). Where several cases share a culprit group, or claims share a capture, the bootstrap resamples the cluster. Paired comparisons: bootstrap CIs of the difference over the same captures, and exact McNemar tests on paired binary outcomes. "p" next to a bootstrap is one-sided and labelled as such.
B1 - Technique identification and the ablation
Question. When several engines look at the same attack telemetry, does fusing their claims rank the true technique higher than any engine alone, and which part of the evidence model is responsible?
Data. The 97 labelled atomic Windows captures of OTRF Security-Datasets (d9d40ef): real Sysmon, Security and PowerShell telemetry recorded while one known ATT&CK technique was emulated in a lab. The label comes from each capture's metadata.
Method. Each capture is replayed through ANVIL (2,410 compiled SigmaHQ Windows rules, 07ec293), REVENANT and the correlation engine. Every technique any engine claims is a candidate; a candidate is correct if its parent technique matches the label. Each analyst scores the candidates; hit@1 (is the top candidate correct?) and MRR are computed in expectation over a uniformly random order of tied scores, because Sigma's confidence takes only five values. The analysts form an ablation of the evidence model:
| analyst | what it isolates |
|---|---|
| A0 Sigma alone | the alert queue: ANVIL's confidence from the rule level |
| REVENANT alone | provenance heuristics |
| A1 union, max | both engines without fusion |
| A2 noisy-OR over every claim | fusion without the independence rule (twenty overlapping Sigma hits count twenty times) |
| A3 noisy-OR per process | fusion of independent engines on the same process, without grouping into incidents |
| A4 THROUGHLINE | incident-level noisy-OR of the best claim of each independent engine |
| A5 A4 without grades | every reliability grade set to A (Sigma level and REVENANT grade ignored) |
| A6 risk-based alerting | risk (100 x base confidence) summed per technique and host |
Results (results/otrf_core.json):
| analyst | recall | hit@1 [95% CI] | MRR [95% CI] | hit@1 if ties favour / disfavour the label | fused minus this: hit@1 | fused minus this: MRR |
|---|---|---|---|---|---|---|
| A0 Sigma alone | 0.680 [0.582, 0.765] | 0.259 [0.201, 0.324] | 0.413 [0.348, 0.480] | 0.577 / 0.093 | +0.114 [0.047, 0.178] | +0.084 [0.039, 0.127] |
| REVENANT alone | 0.454 [0.358, 0.553] | 0.325 [0.237, 0.418] | 0.378 [0.292, 0.469] | 0.361 / 0.289 | +0.048 [-0.018, 0.114] | +0.119 [0.060, 0.185] |
| A1 union (max) | 0.711 [0.615, 0.792] | 0.285 [0.218, 0.357] | 0.437 [0.368, 0.507] | 0.536 / 0.144 | +0.088 [0.030, 0.144] | +0.060 [0.022, 0.098] |
| A2 no independence rule | 0.711 | 0.311 [0.230, 0.396] | 0.453 [0.375, 0.529] | 0.423 / 0.237 | +0.061 [-0.016, 0.137] | +0.043 [-0.005, 0.091] |
| A3 per process, no incidents | 0.711 | 0.370 [0.286, 0.462] | 0.497 [0.420, 0.578] | 0.474 / 0.309 | +0.003 [-0.016, 0.023] | -0.000 [-0.011, 0.013] |
| A4 THROUGHLINE | 0.711 | 0.372 [0.288, 0.462] | 0.497 [0.418, 0.576] | 0.474 / 0.309 | - | - |
| A5 no reliability grades | 0.711 | 0.350 [0.264, 0.435] | 0.473 [0.395, 0.552] | 0.433 / 0.278 | +0.022 [-0.026, 0.076] | +0.024 [-0.011, 0.059] |
| A6 risk-based alerting | 0.711 | 0.272 [0.188, 0.360] | 0.415 [0.339, 0.490] | 0.289 / 0.258 | +0.101 [0.014, 0.187] | +0.081 [0.025, 0.140] |
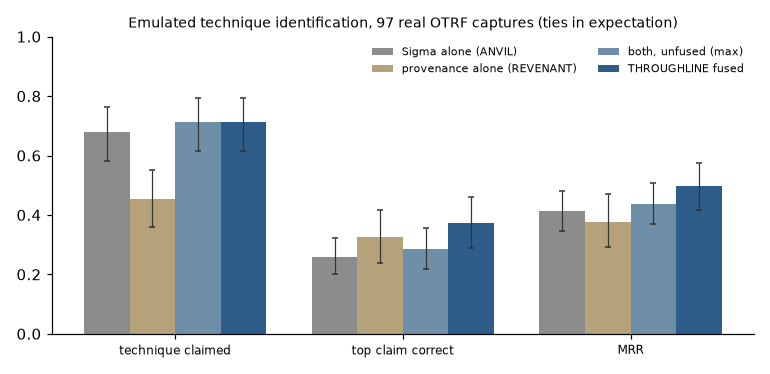
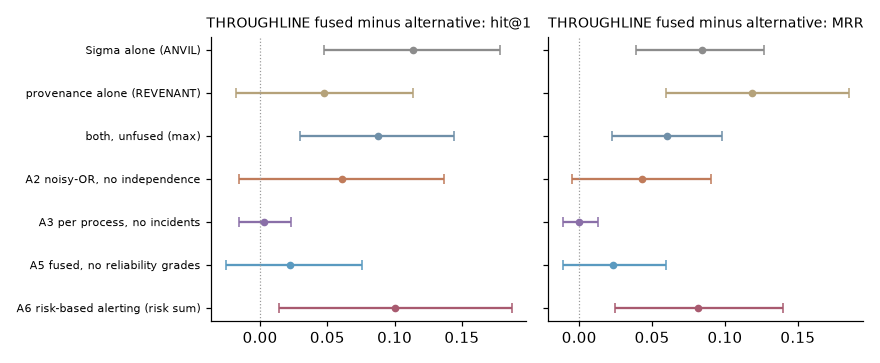
Reading. Fusing independent engines beats Sigma alone, the unfused union and risk-based alerting (every interval of the paired difference excludes zero). Incident grouping contributes nothing to ranking (A3 = A4); the independence rule (A2) and reliability grades (A5) move in the right direction but are not significant at this sample size. With the old alphabetical tie-break, hit@1 was 0.330 for Sigma and 0.392 for fused (both kept in the result file as hit@1_alphabetical): ties had flattered Sigma most.
Calibration, like for like
Raw confidence of every method is over-confident: of the technique claims each method makes, the labelled technique is a small minority (most claimed techniques are genuine but incidental behaviour), so ECE is 0.36-0.38. Calibration is therefore scored after a Platt map fitted on the other folds (5-fold by capture), for every method, and on one shared universe of 785 claims (every candidate any engine claimed; a method that did not claim it scores 0):
| analyst | Brier (shared) | ECE | AUC | Brier skill vs base rate | Brier, fused minus this [capture-clustered CI] |
|---|---|---|---|---|---|
| Sigma alone | 0.123 | 0.007 | 0.667 | 0.023 | -0.013 [-0.020, -0.006] |
| REVENANT alone | 0.123 | 0.003 | 0.580 | 0.021 | -0.013 [-0.020, -0.006] |
| union (max) | 0.118 | 0.026 | 0.693 | 0.062 | -0.008 [-0.013, -0.002] |
| A3 per process | 0.111 | 0.028 | 0.741 | 0.117 | -0.001 [-0.002, 0.001] |
| THROUGHLINE fused | 0.111 | 0.030 | 0.746 | 0.122 | - |
| risk-based alerting | 0.126 | 0.015 | 0.573 | -0.001 | -0.015 [-0.023, -0.008] |
On each method's own claims, a Platt map reaches ECE 0.03 for Sigma (665 claims) and fused (785), but REVENANT stays at 0.114 (195 claims). The fitted fused map ships in the package (throughline/data/calibration.json, ADR-0006).
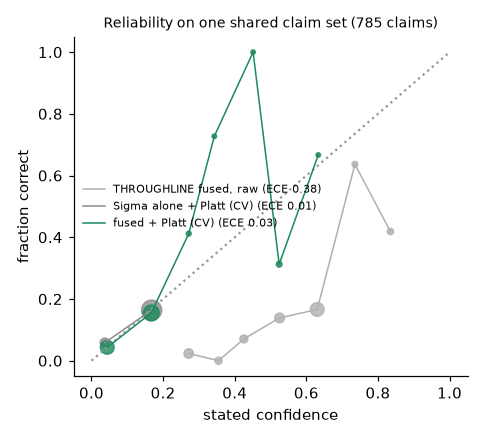
Corroboration curve
| claims backed by | claims | precision [Wilson] | captures whose label is claimed |
|---|---|---|---|
| at least one engine | 785 | 0.148 [0.125, 0.174] | 0.711 [0.615, 0.792] |
| both engines | 75 | 0.507 [0.396, 0.617] | 0.381 [0.291, 0.481] |
The same trade-off TRACE-CTI reports for extracted CTI claims as more extraction setups must agree (precision 25.3% -> 90.6%, recall 88.2% -> 16.3%; Valletta et al., arXiv:2607.24563).
B2 - Alerts, incidents, prioritisation and analyst effort
Compression. 6,056 Sigma alerts, 838 distinct (rule, host) pairs, 384 incidents over the 97 captures: 15.8x fewer incidents than raw alerts, 2.2x fewer than de-duplicated alerts (median per capture: 17 alerts, 6 de-duplicated, 3 incidents). The labelled technique is in the top-ranked incident for 56.7% of captures and in some incident for 69.1%.
Prioritisation (Uetz et al.'s question, arXiv:2609.02465): the same 379 incidents, 97 of which contain the labelled technique, ranked by four scores. Capture-clustered CIs.
| incident score | AUROC [95% CI] |
|---|---|
| highest Sigma severity among its alerts | 0.796 [0.749, 0.839] |
| THROUGHLINE fused score | 0.795 [0.740, 0.849] |
| alert count | 0.767 [0.706, 0.820] |
| summed risk (risk-based alerting) | 0.744 [0.685, 0.801] |
Uetz et al. find risk-based alerting far ahead of severity order on eight alert datasets (0.92 vs 0.72); on these single-technique captures neither risk nor fusion beats severity.
Analyst effort. Items read before reaching the labelled technique (ties in expectation; 64 captures where both queues reach it):
| queue | median | mean [95% CI] |
|---|---|---|
| alerts in time order | 4 | 5.3 [4.2, 6.4] |
| alerts by severity | 2 | 5.0 [2.6, 9.2] |
| de-duplicated alerts by severity | 2 | 2.1 [1.8, 2.5] |
| THROUGHLINE incidents opened | 1 | 1.45 [1.17, 1.80] |
| THROUGHLINE lines read (incident summary + technique lines) | 2.5 | 4.6 [3.3, 6.2] |
Lines read minus severity-sorted alerts: -0.3 [-3.7, 2.1] items. The incident view needs one or two incidents opened, but no fewer items read than a severity-sorted, de-duplicated alert queue.
B3 - Attribution
Question. Do two ACH engines written as competing claims, with UNKNOWN as a hypothesis, attribute more reliably than either alone or than naive TTP similarity, and do they survive false flags?
Methods. similarity (OCCAM's IDF-cosine nearest profile), dragnet, occam, and fused (both verdicts as ATTRIBUTED_TO claims in a THROUGHLINE graph; the confidence engine combines agreeing engines by noisy-OR and discounts competing hypotheses). "Confident" is each method's own rule: DRAGNET MEDIUM+, OCCAM moderate+, similarity p >= 0.8, fused >= 0.5. False flags follow DRAGNET's stress test: a copied Rich header and decoy-language strings point at a decoy group from another country (level 1); level 2 adds a malware family exclusive to the decoy. OCCAM receives the equivalent spoofable markers.
Case sets (results/attribution.json):
| setting | cases | groups | protocol |
|---|---|---|---|
| leave-report-out | 448 | 149 | one case per (group, cited report) in v19.2 with >= 5 techniques, at most 8 per group; 5 folds by report, the fold's report-only relationships removed from the STIX both engines load (3,416 removed; a case's techniques still in its group's profile: 100% -> 51.7%) |
| temporal: campaigns | 17 | 11 | campaigns documented after ATT&CK v10.1, group in v10.1, profiles from v10.1 |
| temporal: new malware families | 79 | 25 | families first published after v10.1, used by exactly one v10.1 group, evidence = their techniques only |
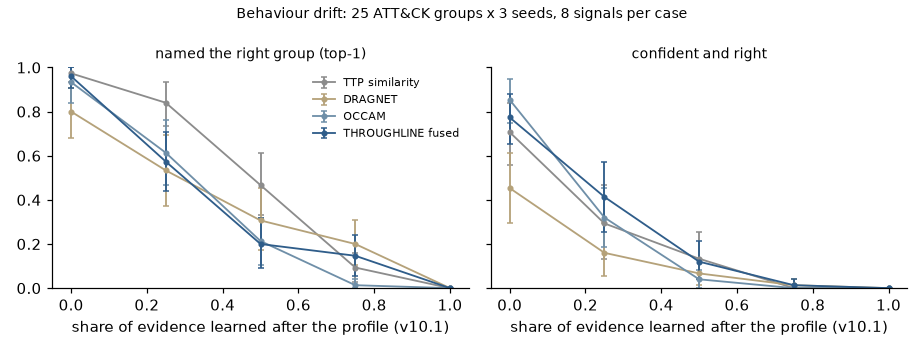
| behaviour drift | 75 per dose | 25 | 8 signals, a share f learned after v10.1, the rest from the v10.1 profile, 3 seeds |
| retrospective (upper bound) | 25 | - | campaigns against v19.2 profiles (ATT&CK copies campaign techniques onto the group) |
Leave-report-out
| 448 cases | TTP similarity | DRAGNET | OCCAM | fused |
|---|---|---|---|---|
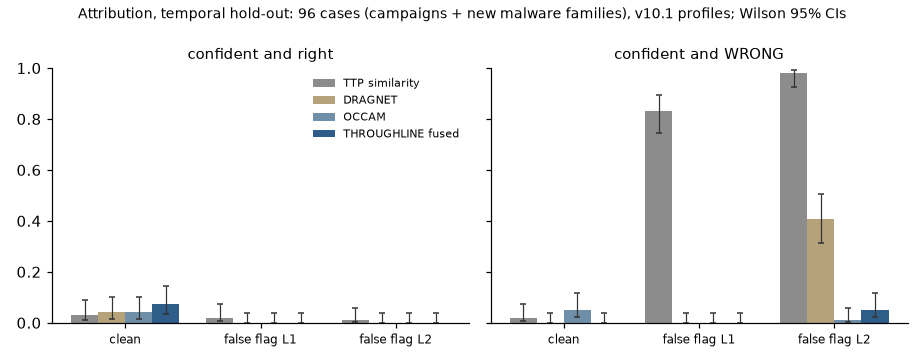
| clean: confident and right | 13.8% [11.0, 17.4] | 13.0% [10.2, 16.4] | 13.2% [10.4, 16.6] | 19.2% [15.8, 23.1] |
| clean: confidently wrong | 1.8% [0.9, 3.5] | 0.7% [0.2, 2.0] | 3.1% [1.9, 5.2] | 0.7% [0.2, 2.0] |
| clean: precision of confident calls | 0.886 | 0.951 | 0.808 | 0.966 |
| clean: top-1 (any confidence) | 0.440 [0.395, 0.486] | 0.382 [0.338, 0.428] | 0.281 [0.242, 0.325] | 0.377 [0.334, 0.423] |
| clean: AURC (lower is better) | 0.312 | 0.266 | 0.462 | 0.286 |
| false flag L1: confidently wrong | 75.2% | 0.0% | 0.2% | 0.0% |
| false flag L2: confidently wrong | 96.0% | 18.5% [15.2, 22.4] | 1.6% [0.8, 3.2] | 5.6% [3.8, 8.1] |
| false flag L2: named the decoy (any confidence) | 98.2% | 63.6% | 7.1% | 46.2% |
Exact McNemar, fused vs each (cases right only under fused / only under the other):
| outcome | vs similarity | vs DRAGNET | vs OCCAM |
|---|---|---|---|
| confident and right (clean) | 54 / 30, p = 0.012 | 43 / 15, p = 0.0003 | 35 / 8, p < 0.0001 |
| top-1 (clean) | 39 / 67, p = 0.008 (similarity better) | 25 / 27, p = 0.89 | 52 / 9, p < 0.0001 |
| confidently wrong, false flag L2 (fewer is better) | 0 / 405 | 16 / 74 | 18 / 0 (OCCAM better) |
Temporal hold-out
| TTP similarity | DRAGNET | OCCAM | fused | |
|---|---|---|---|---|
| 17 campaigns: confident and right | 17.6% | 23.5% | 23.5% | 41.2% [21.6, 64.0] |
| 17 campaigns: top-1 | 0.529 | 0.412 | 0.471 | 0.412 |
| 79 new families: top-1 | 0.038 | 0.025 | 0.000 | 0.000 |
| 79 new families: confidently wrong | 2.5% | 0.0% | 6.3% | 0.0% |
| all 96: confident and right | 3.1% | 4.2% | 4.2% | 7.3% [3.6, 14.3] |
| all 96: confidently wrong | 2.1% | 0.0% | 5.2% | 0.0% [0.0, 3.8] |
On the 17 campaigns the fused gain is 3 discordant cases to 0 (exact McNemar p = 0.25, not significant); the leave-report-out set is what makes it measurable. New malware families are essentially unattributable from their techniques by any method: their techniques are not in the group's earlier profile.
Behaviour drift (dose-response)
| share of evidence learned after v10.1 | 0 | 0.25 | 0.5 | 0.75 | 1 |
|---|---|---|---|---|---|
| top-1: similarity | 0.97 | 0.84 | 0.47 | 0.09 | 0.00 |
| top-1: DRAGNET | 0.80 | 0.53 | 0.31 | 0.20 | 0.00 |
| top-1: OCCAM | 0.93 | 0.61 | 0.21 | 0.01 | 0.00 |
| top-1: fused | 0.96 | 0.57 | 0.20 | 0.15 | 0.00 |
| confident and right: fused / DRAGNET / OCCAM | 0.77 / 0.45 / 0.85 | 0.41 / 0.16 / 0.32 | 0.12 / 0.07 / 0.04 | 0.01 / 0.01 / 0.00 | 0 / 0 / 0 |
| confidently wrong: fused / OCCAM | 0.00 / 0.00 | 0.00 / 0.08 | 0.00 / 0.07 | 0.01 / 0.11 | 0.01 / 0.11 |
Intervals in the figure are bootstrap over groups (all seeds of a group together). At f = 0 the evidence is in the profile by construction; at f = 1 it never is.
Calibration of committed verdicts (pooled clean leakage-controlled cases): fused Brier 0.215, ECE 0.216, AUC 0.835 (262 named verdicts); similarity 0.170 / 0.048 / 0.812 (544); DRAGNET 0.180 / 0.276 / 0.850 (211). Fused confidence ranks verdicts well but is not a calibrated probability.
B4 - APT29 evaluation, days 1 and 2
Data. The OTRF APT29 evaluation captures (MITRE ATT&CK Evaluations round 2, four Windows hosts) and the CTID APT29 emulation plan that the evaluation followed (4467a6e, Apache-2.0): 79 procedures with step ids and ATT&CK techniques; scenario 1 (steps 1-10) is day 1, scenario 2 (steps 11-20) is day 2. Lateral movement is resolved to host pairs from the logged command lines (benchmarks/truth/apt29_lateral.yaml): day 1 SCRANTON -> NASHUA (PsExec, step 8.B); day 2 UTICA -> NEWYORK (WinRM + Mimikatz on the domain controller, 16.C) and UTICA -> SCRANTON (Invoke-Command, 20.A.1).
| day 1 | day 2 | |
|---|---|---|
| records / normalised events / claims | 196,081 / 144,988 / 152,340 | 587,286 / 408,426 / 419,488 |
| Sigma alerts -> incidents | 2,888 -> 60 | 3,734 -> 84 |
| plan: procedures / techniques / parent techniques | 58 / 31 / 29 | 21 / 17 / 16 |
| plan parent techniques found: Sigma / REVENANT / union / fused | 15 / 6 / 16 / 16 | 9 / 4 / 10 / 10 |
| plan steps covered (fused) | 58.6% | 66.7% |
| precision@5 / @10 / @20: Sigma | 0.33 / 0.33 / 0.34 | 0.22 / 0.22 / 0.22 |
| precision@5 / @10 / @20: union | 0.44 / 0.36 / 0.34 | 0.34 / 0.26 / 0.21 |
| precision@5 / @10 / @20: fused | 0.55 / 0.40 / 0.34 | 0.40 / 0.33 / 0.25 |
| multi-host clusters / true pairs found / joined pairs | 1 / 1 / 1 | 2 / 2 / 2 |
| 1.0.0 stitching: clusters / true / joined pairs | 4 / 1 / 3 | 1 / 2 / 3 |
| pipeline seconds / peak RSS on the CI runner | 84 s / 2.7 GB | 269 s / 8.1 GB |
Precision@k counts observed parent techniques in the plan; observed techniques outside the plan can be genuine (background activity, techniques the plan's YAML files under a different id), so it is a lower bound. Of the 13 day-1 plan techniques no analyst claimed, 7 are discovery and collection commands (T1007, T1012, T1016, T1018, T1049, T1083, T1119) on which no rule or heuristic fired; the rest are T1037, T1041, T1105, T1112, T1134 and T1529.
Attribution oracle. On the plan's own techniques DRAGNET abstains (INSUFFICIENT) and ranks APT29 70th of 152 (day 1) and 35th of 149 (day 2); OCCAM does not shortlist it; the fused verdict is UNKNOWN. ATT&CK's APT29 profile (47 parent techniques) contains 34% of the day-1 plan techniques and 50% of day 2's. Detection is not what stops attribution here.
Other OTRF compound captures
APT3 (OTRF's Empire emulation and a CALDERA run of the ATT&CK Evaluations round 1 plan, both raw Winlogbeat exports) and seven LSASS credential-dumping campaigns (Metasploit plus a different dumping tool each) go through every engine. There is no per-event or per-host ground truth for APT3, so it is a robustness and attribution check; the LSASS campaigns' metadata lists the emulated techniques. Script: benchmarks/bench_compound.py, outputs: results/compound*.json.
| capture | records | Sigma alerts -> incidents | hosts | cross-host clusters | APT3's best rank: DRAGNET / OCCAM |
|---|---|---|---|---|---|
| APT3, Empire | 121,659 | 1,047 -> 18 | 3 | 1 (hfdc01 + hr001, shared internal endpoint 10.0.10.106:443) | 4 of 148 / 2 of 25 |
| APT3, CALDERA round 1 | 101,904 | 48,136 -> 13 | 4 | 0 | 1 of 154 / 6 of 25 |
Neither engine names APT3 with confidence: the fused verdict on every top incident is UNKNOWN, although DRAGNET ranks APT3 first among 154 hypotheses on the CALDERA run's top incident. Every LSASS campaign's credential dump (T1003.001) is found. Of the 59 technique instances the seven campaigns document, Sigma alone finds 30, REVENANT 16, the union 32 and the fused incidents 31; 14 of the 59 are pre-compromise (T1587.001 develop capabilities, T1608.001 stage capabilities) and cannot appear in host logs, and most of the rest that no engine finds are Metasploit's exfiltration over its C2 channel (T1041) and tool transfer (T1105).
B5 - Feedback loop
results/feedback_loop.json: 97 captures, 66 detected, 31 gaps. Heuristic drafter: 22 gaps with novel behaviour, 27 drafts, 20 rejected by the false-positive gate, 1 that never fired on its own capture, 6 accepted (5 gaps closed; coverage 68.0% -> 73.2%, in-sample); none fires on a second capture of its technique. Keyword baseline: 21 drafts, 18 rejected, 3 accepted, 3 gaps closed, 1 generalises. The loop-revalidation CI job re-runs the read-only discovery command behind one accepted draft (net localgroup Administrators, T1069.001) on a fresh Windows runner with process-creation auditing on, after a baseline of ordinary administration: the drafts mined from it must fire on the re-run, and every accepted draft must stay silent on the baseline.
Supply chain
results/supplychain_healthchecks.json: 236 pin-changing commits of healthchecks' requirements.txt, 311 pinned versions, 121 with an OSV advisory (291 advisories; worst severity critical 101, high 7, medium 13). Of 4,986 (version, advisory) pairs, 2 had the advisory published by the day the version was pinned. Median exposure 31 days (p90 144). One vulnerable version is pinned at the analysed commit (pyjwt==2.13.0). Introducing commit vs git blame at HEAD: 15/15 [Wilson 0.80, 1.00], agreement with TRACEGATE's own blame helper (shared pin parser), not an independent oracle; TRACEGATE v1.1.0 reports 88.8% agreement on 3,203 pairs and 231/231 on an independent oracle of bot bumps.
Comparison with published work
| claim | published | here | comparable? |
|---|---|---|---|
| Risk-based alerting beats severity order for prioritisation (Uetz et al., 2026) | AUROC 0.92 vs 0.72, 8 alert datasets | 0.744 vs 0.796, 379 incidents of 97 captures | different data and units (alerts vs incidents); the effect does not reproduce here |
| Agreement raises precision, lowers recall (TRACE-CTI, 2026) | 25.3% -> 90.6% precision, 88.2% -> 16.3% recall | 14.8% -> 50.7% precision, 71.1% -> 38.1% capture recall | same shape; different claims (CTI extraction vs runtime engines) |
| Sigma detection of OTRF recordings (GAUNTLET v1.1.0) | 68.4% of recordings, 2,519 rules | 68.0% of captures, 2,410 rules | close; different rule snapshot and selection |
| TTP-based attribution breaks down (Balassone et al., 2026) | qualitative (emulated APTs converge on tactics no profile encodes) | new families 0-4% top-1; APT29 not named even from its plan | consistent |